Novel indole derivatives as hepatitis C virus NS5B polymerase inhibitors: Pharmacophore modeling and 3D QSAR studies
Abstract
Hepatitis C Virus (HCV) encodes its own RNA dependent RNA polymerase (NS5b) in order to replicate its genome. An efficient pharmacophore was identified, by executing structural analysis of a set of 49 indole-based inhibitors of the HCV NS5B polymerase. Identified pharmacophoric features, two hydrophobic regions, and 4 aromatic rings i.e. HHRRRR.649. Ligand-based 3D-QSAR was performed, partial least square regression analysis was employed which gave a regression coefficient R2 of 0.98 and Q2 of 0.88, and Pearson-R of 0.96.
Introduction
Hepatitis C Virus (HCV) infection evolved as a global pandemic, affecting about 3% of the world population (approximately 170 million people) (Clin et al., 2009). About 80% of the pathology is chronic, leading to liver cirrhosis and hepatocellular carcinoma (El-serag et al., 2004). Virology of HCV uncovers, a single positive stranded RNA virus belongs to Flaviviridae family (Verna et al., 2008). Non-structural 5B (NS5B) polymerase is responsible for the replication of viral genome (Behrens et al., 1996). It has become a potential target for inhibition of replication of HCV genome and perhaps terminating the prevalence of HCV disease.
Based on chemical composition and/or mechanism of action NS5B inhibitors are categorized into four major classes such as nucleoside or nucleotide analogs (as competitors of NTPs during RNA synthesis), non-nucleoside inhibitors (allosterically aim the NS5B) (Bressaneli et al., 1999; Lesburg et al., 1999), inhibitors covalently change the residues near the active site of NS5B, and compounds that target cellular proteins needed for HCV polymerase function (Biswal et al., 2005; Love et al., 2003; Wang et al., 2003). Since there is still no effective, well-tolerated treatment for HCV infection, alternative novel therapies are needed. In the present investigation we focused on the identification and elucidation of common pharmacophore model from the previously published series of Indole derivatives which are having significant inhibitory profile over HCV NS5B (Kevin et al., 2011). And also, we have developed a 3D QSAR model for validation of obtained pharmacophore model.
Materials and Methods
Dataset ligands
A series of 49 indole derivatives are used in this study (Kevin CX et al., 2011). Table I (A-E) shows the structures of the compounds used and their observed activity (pIC50). The in vitro biological activity data was stated in terms of IC50. These IC50 values were converted to pIC50 using the formula (pIC50= -log IC50). The distribution of pIC50 for the whole data set ranges from 4.7 to 9.0. We divided the data set, randomly choosing 39 compounds to be in the QSAR training set and 10 compounds for the test set on the basis of pIC50 threshold range.
Table IA: Dataset ligands and their QSAR results
| Compound No. | R4 | R5 | R6 | pIC50 experimental | pIC50 predicted | Pharm set | Data set |
|---|---|---|---|---|---|---|---|
| 2 | H | Cl | H | 7.3 | 7.1 | Training | |
| 13 | Cl | Cl | H | 6.1 | 6.4 | Inactive | Training |
| 14 | Br | H | H | 5.4 | 5.9 | Inactive | Test |
| 15 | H | Cl | Cl | 7.3 | 7.4 | Training | |
| 16 | H | Br | H | 7.4 | 7.5 | Training | |
| 17 | H |  |
H | 5.2 | 4.9 | Inactive | Training |
| 18 | H | H | 7.2 | 7.1 | Training | ||
| 19 | H | H | 5.9 | 6.1 | Inactive | Training | |
| 20 | H | H | 6.5 | 6.2 | Inactive | Training | |
| 21 | H | ethyne | H | 7.3 | 7.4 | Training | |
| 22 | H | OH | H | 4.7 | 4.9 | Inactive | Training |
| 23 | H | H | 7.8 | 7.8 | Active | Training | |
| 24 | H | CF3 | H | 7.8 | 7.7 | Active | Test |
Table IB: Dataset ligands and their QSAR results
| Compound No. | R1 | pIC50 experimental | pIC50 predicted | Pharm set | Data set |
|---|---|---|---|---|---|
| 24 | 7.8 | 7.7 | Active | Test | |
| 25 | 7.7 | 7.6 | Active | Training | |
| 26 | 8.0 | 8.0 | Active | Training | |
| 27 | 8.0 | 8.0 | Active | Training | |
| 28 | 8.0 | 8.0 | Active | Training | |
| 29 | 7.8 | 7.9 | Active | Training | |
| 30 | 7.8 | 7.3 | Active | Test | |
| 31 | 8.3 | 8.4 | Active | Training | |
| 32 | 8.4 | 8.5 | Active | Training | |
| 33 | 8.2 | 8.2 | Active | Training | |
Table IC: Dataset ligands and their QSAR results
| Compound No. | R5 | pIC50 experimental | pIC50 predicted | Pharm set | Data set |
|---|---|---|---|---|---|
| 32 | CF3 | 8.4 | 8.5 | Active | Training |
| 34 | -OCF3 | 7.6 | 7.9 | Active | Training |
| 35 | -OCH3 | 7.8 | 7.3 | Active | Training |
| 36 | -C2H5 | 7.1 | 7.6 | Test | |
| 37 | 6.8 | 6.8 | Inactive | Training | |
| 38 | ME | 8.1 | 8.1 | Active | Training |
| 39 | C2H5 | 8.4 | 8.0 | Active | Test |
| 40 | Br | 8.5 | 8.5 | Active | Training |
| 41 | -CH2CF3 | 8.1 | 8.2 | Active | Training |
| 42 | -C(CH3)3 | 8.1 | 8.1 | Active | Training |
| 43 | 8.0 | 8.1 | Active | Training | |
Table ID: Dataset ligands and their QSAR results
| Compound No. | R5 | R2 | pIC50 experimental | pIC50 predicted | Pharm set | Data set |
|---|---|---|---|---|---|---|
| 44 | CH3 | CH3 | 8.2 | 8.2 | Active | Training |
| 45 | CH3 | C2H5 | 8.0 | 8.1 | Active | Training |
| 46 | CH3 | -CH(CH3)2 | 8.2 | 8.1 | Active | Training |
| 47 | CH3 | Cyclo propane | 8.2 | 8.2 | Active | Training |
| 48 | C2H5 | CH3 | 8.2 | 8.1 | Active | Training |
| 49 | C2H5 | C2H5 | 8.2 | 8.0 | Active | Test |
| 50 | C2H5 | -CH(CH3)2 | 8.3 | 8.1 | Active | Test |
| 51 | C2H5 | Cyclo propane | 8.5 | 8.5 | Active | Training |
Table IE: Dataset ligands and their QSAR results
| Compound No. | R5 | R6 | pIC50 experimental | pIC50 predicted |
Pharm set | Data set |
|---|---|---|---|---|---|---|
| 52 | CF3 | H | 8.5 | 8.7 | Active | Training |
| 47 | CH3 | H | 8.2 | 8.2 | Active | Training |
| 51 | C2H5 | H | 8.5 | 8.5 | Active | Training |
| 53 | -C(CH3)3 | H | 8.2 | 8.2 | Active | Training |
| 54 | H | 8.2 | 8.2 | Active | Training | |
| 55 | -CH2CF3 | H | 8.2 | 8.2 | Active | Training |
| 56 | CH3 | F | 8.1 | 8.4 | Active | Test |
| 57 | CH3 | Cl | 8.3 | 8.4 | Active | Training |
| 58 | CH3 | CF3 | 8.2 | 8.7 | Active | Training |
| 59 | CF3 | F | 8.2 | 8.1 | Active | Training |
| 60 | C2H5 | F | 8.3 | 8.3 | Active | Training |
Ligand preparation
Ligand library was produced by using `LigPrep` module of Schrodinger suite. The simplest use of LigPrep, input structures (2D) were changed over to a single, energy minimized (3D) structure with correct chirality's. At most 32 stereoisomers will generate for each ligand of these 1 low energy ring conformer with best ionization state is preferred. Tools used for ionization states, tautomers, stereo chemistries, and ring conformations, are OPLS 2005 for Force Field energy minimizer, Epik module is selected for ionization process, tautomeric states (Shelley et al., 2007). Energy minimization for whole ligand library was performed with same parameters mentioned above (Ligprep, version 2.6).
Generation of common pharmacophore hypotheses
Pharmacophore hypothesis and 3D QSAR were performed using PHASE module. This work concerns about pharmacophore perception, structural alignment and activity prediction. Given a set of 49 molecules with affinity for a particular proposition target, the fine-grained conformational sampling analysis and a range of scoring techniques to identify common pharmacophore hypothesis of the module, convey the characteristics of 3D chemical structures that are reported to be crucial for binding (PHASE, version 3.5; Dixon et al., 2006). The pharmacophore model was developed using a set of criterion pharmacophore features to generate sites for all the compounds. PHASE provides a standard set of six pharmacophore features, hydrogen bond acceptor (A), hydrogen bond donor (D), hydrophobic group (H), negatively ionizable (N), positively ionizable (P), and aromatic ring (R). All the ligands were categorized into active (pIC50>7.5), inactive (pIC50<7) and intermediate (pIC50: 7-7.5) according to the activity thresholds. Maximum of six and a minimum of five sites were selected in order to obtain an efficient pharmacophore model. Hypotheses were generated by a systematic variation of number of sites (nsites) and the number of matching active compounds (nact). With nact = nact - tot. Initially (nact - tot) is the total number of active compounds in the training set, nsites (Rajendra Prasad et al., 2013). The scoring protocol provides ranking of different hypotheses to choose most appropriate for further investigation. The larger is the difference between the score of active and inactive, the best is the hypothesis at discriminating the active from inactive molecules.
QSAR studies
For QSAR development, pharmacophore models of training set molecules were localized into regular grid of cubes, with each cube allotted zero or more `bits` to account for the different type of pharmacophore features in the training set that occupy the cube. This representation gives rise to binary-valued occupation patterns that can be used as independent variables to create partial least-squares (PLS) factors 3D-QSAR models. Statistical correlation of predicted with actual activity data were collated for the hypothesis. Our dataset is congeneric, but have many rotatable bonds, so we addressed a pharmacophore-based QSAR model. Pharmacophore-based QSAR models were generated for hypothesis using 39 training set ligands (80% of dataset were selected randomly) and 1.0 Angstrom of grid spacing. QSAR models from one to nine PLS factors were generated, and the models were validated by predicting the activity of test set ligands.
validation. The cross validated coefficient, R2cv, was calculated using the following equation 1:
= 1- (sum( )2)/ (sum(Yobserved -Ymean)2)……………..(1)
Here, Ypredicted, Yobserved, and Ymean are the predicted, observed and mean values of the target property (pIC50) respectively. (Yobserved - Ymean)2 is the predictive residual sum of squares (PRESS). The predictive correlation coefficient (r2pred), based on molecules of test set, is defined as,
Result and Discussion
Pharmacophores from all conformations of the ligands in the active set are examined, and those pharmacophores that match identical sets of features with very similar spatial arrangements are grouped together. If a given group contains at least one pharmacophore from each ligand, then this group gives rise to a common pharmacophore.
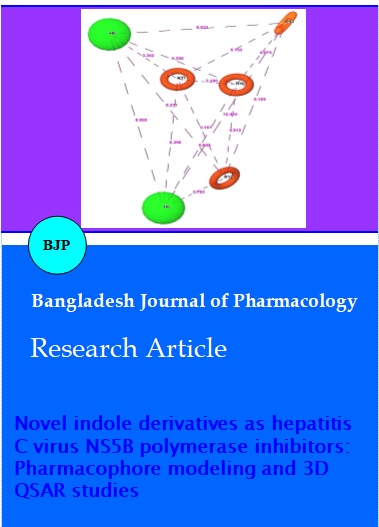
We have selected maximum number of sites should be six because if the number of sites is too large, it will be too hard to find any common pharmacophores, but if the number of sites is too small, the common pharmacophores might not contain all required features, and therefore might not discriminate between actives and inactives very well. Then search starts from the highest number and shifts to the lower number of sites until it either finds common pharmacophores. We got 77 different variant lists from which eight hypotheses were obtained. They are AHHRRR (37), HHRRRR (20), HHH-RRR (40), AHHHRR (46), HNRRRR (15), AHNRRR (19), AHHNRR (8), and HHNRRR (9). Total of 25 common pharmacophore hypotheses were obtained from the three variant hypotheses HHRRRR.649, HHH-RRR.731, AHHRRR. 355. We have identified a six feature pharmacophoric model consisting two hydrophobic groups, and four aromatic ring systems (HHR-RRR.649) and examined its structural features, the inter-pharmacophoric sit distances (Table II) and 3D spatial arrangement (Figure 1).
Table II: Distance between pharmacophoric sites in 3D spatial arrangement
| Site1 | Site2 | Distance (Angstrom) |
|---|---|---|
| H6 | H8 | 8.865 |
| H6 | R10 | 6.643 |
| H6 | R11 | 6.396 |
| H6 | R12 | 2.762 |
| H6 | R13 | 10.454 |
| H8 | R10 | 5.358 |
| H8 | R11 | 3.392 |
| H8 | R12 | 8.271 |
| H8 | R13 | 6.623 |
| R10 | R11 | 2.196 |
| R10 | R12 | 4.612 |
| R10 | R13 | 4.075 |
| R11 | R12 | 5.161 |
| R11 | R13 | 5.153 |
| R12 | R13 | 8.169 |
Figure 1: 3D spatial arrangement of pharmacophoric features of HHRRRR.649
Phase entails to build 3D QSAR models for a set of ligands that are aligned to a selection of hypotheses, and to visualize these models along with the ligand structures and the hypotheses. The QSAR models are developed from a series of ligands that have a range of activities. 80% of Dataset was randomly segregated into training and remaining as test sets for internal validation.
Partial least squares (PLS) Regression analysis was employed to build a potential QSAR model of the dataset ligands over HHRRRR.649 hypothesis (Table III). Regression analysis of total nine factors were given of which result of PLS-6 was considered to be the best as the regression coefficients r2 is 0.98 (for training set), q2 is 0.88 (for test set) and Pearson-R is 0.96 . Predicted activity of all the dataset ligands obtained from QSAR studies considering PLS 6 were listed in Table I.
Table III: Regression coefficients of common pharmacophore of HHRRRR.649
| ID | #Factor | SD | R- Squared | F | P | Q- Squared | Pearson-R |
|---|---|---|---|---|---|---|---|
| HHRRRR.649 | 1 | 0.6165 | 0.5479 | 45.1 | 5.939e-008 | 0.7186 | 0.9796 |
| 2 | 0.5101 | 0.6953 | 42.2 | 2.823e-010 | 0.7564 | 0.9143 | |
| 3 | 0.3018 | 0.8963 | 103.7 | 8.99e-018 | 0.7641 | 0.9313 | |
| 4 | 0.2273 | 0.9428 | 114.2 | 3.157e-021 | 0.8212 | 0.9505 | |
| 5 | 0.1802 | 0.9651 | 187.8 | 9.599e-024 | 0.8452 | 0.923 | |
| 6 | 0.131 | 0.9821 | 301.2 | 2.394e-027 | 0.8816 | 0.9584 |
QSAR result can also be validated by using Craig's plot. In this, actual (experimental) and predicted activities obtained from the QSAR based on PLS regression analysis was extrapolated and results were correlated with each other. The slope of the line represents the regression coefficient of the ligands considered. As the regression coefficient is nearer to one, the slope of the line passes nearer to the origin of the plot. Efficiency of the system was based on the slope of the line and the alignment of the ligands around the line.
We signify, the derived common pharmacophore through ligand based 3D-QSAR consists of six pharmacophore features HHRRRR, provides possible structural modifications for the strategic design of more potent derivatives in the treatment of hepatitis C virus.
Acknowledgements
The first author is grateful to thank Prof. V. V. S. Rajendra Prasad of Vishnu Institute of Pharmaceutical Education and Research for supporting and providing facilities to perform in silico studies. We also thank Schrodinger Inc, India for providing us with academic trial license for the current study.
References
Basu A, Jasu K, Jayaprakash V, Mishra N, Ojha P, Bhattacharya S. Development of CoMFA and CoMSIA models of cytotoxicity data of anti-HIV-1-phenylamino-1H-imidazole derivatives. Eur J Med Chem. 2009; 44: 2400-07.
Behrens SE, Tomei L, De Francesco R. Identification and properties of the RNA-dependent RNA polymerase of hepatitis C virus. Eur Mol Biol Organ J. 1996; 15: 12-22.
Biswal BK, Cherney MM, Wang M, Chan L, Yannopoulos CG, Bilimoria D, Nicolas O, Bedard J, James MNG. Crystal structures of the RNA-dependent RNA polymerase genotype 2a of hepatitis C virus reveal two conformations and suggest mechanisms of inhibition by nonnucleoside inhibitors. J Biol Chem. 2005; 280: 18202-10.
Bressaneli S, Tomei L, Roussel A, Incitti I, Vitale RL, Mathieu M, De Francesco R, Rey FA. Crystal structure of the RNA-dependent RNA polymerase of hepatitis C virus. Proc Natl Acad Sci USA. 1999; 96: 13034-39.
Clin CJ. The global surden of Hepatitis C working group. Global Burden of Disease (GBD) for hepatitis C. Pharmacology 2009; 44: 20-29.
Dixon SL, Smondyrev AM, Knoll EH, Rao SN, Shaw DE, Friesner RA. PHASE: A new engine for pharmacophore perception, 3D QSAR model development, and 3D database screening: 1. Methodology and preliminary results. J Comput Aided Mol Des. 2006; 20: 647-71.
El-serag HB. Hepatocellular carcinoma: Recent trends in United States. Gastroenterology 2004; 5: S27-34.
Golbraikh A, Tropsha A. Beware of q2!. J Mol Graphics Modell. 2002; 20: 269-76.
Banchavibulbhan KX, Yang W, Sannigrahi M, Velazquez F, Chan TY, Venkatraman S, Gopinandhan N, Kumar A, Zeng Q, Bennet F, Jiang Y, Lesburg CA, Duca J, Pinto P, Gavalas S, Huang Y, Wu W, Selyutin O, Agrawal S, Feld B, Huang HC, Li C, Cheng KC, Shih NY, Kozlowski JA, Resenclum SB, F. George Njoroge FG. Structure–activity relationship (SAR ) development and discovery of potent indole based inhibitors of the hepatitis c virus (HCV) NS5B polymerase. J Med Chem. 2012; 55: 754-65.
Lesburg CA, Cable MB, Ferrari E, Hong Z, Mannarino AF, Weber PC. Crystal structure of the RNA-dependent RNA polymerase from hepatitis C virus reveals a fully encircled active site. Nat Struct Biol. 1999; 6: 937-43.
Ligprep, version 2.6 Schrödinger, LLC, New York, 2013.
Love RA, Parge HE, Yu X, Hickey MJ, Diehl W, Gao J, Wriggers H, Ekker A, Wang L, Thomson JA, Dragovich PS, Fuhrman SA. Crystallographic identification of a noncompetitive inhibitor binding site on the hepatitis C virus NS5B RNA polymerase enzyme. J Virol. 2003; 77: 7575-81.
Lu P, Wei X, Zhang R. CoMFA and CoMSIA 3D-QSAR studies on quionolone carboxylic acid derivatives inhibitors of HIV-1 integrase. Eur J Med Chem. 2010; 45: 3413-19.
PHASE, version 3.5, Schrödinger, LLC, New York, NY, 2013.
Rajendra Prasad VVS, Deepak Reddy G, Appaji D, Peters GJ, Mayur YC. Chemosensitizing acridones: In vitro calmodulin dependent cAMP phosphodiesterase inhibition, docking, pharmacophore modeling and 3D QSAR studies. J Mol Graphics Modell. 2013; 40: 116-24.
Shelley JC, Cholleti A, Frye LL, Greenwood JR, Timlin MR, Uchiyama M. Epik: A software program for pKa prediction and protonation state generation for druglike molecules. J Comput Aided Mol Des. 2007; 21: 681-91.
Verna EC, Brown RS. Hepatitis C and liver transplantation: Enhancing outcomes and should patients be retransplanted. Clin Liver Dis. 2008; 12: 637-59.
Wang M, Ng KKS, Cherney MM, Chan L, Yannopoulos CG, Bedard J, Morin N, Nguyen-Ba N, Alaoui-Ismaili MH, Bethell RC, James MNG. Nonnucleoside analogue inhibitors bind to an allosteric site on HCV NS5b polymerase. J Biol Chem. 2003; 278: 9489-95.