Notch 1 signaling pathway is the potential target of novel anticancer drugs for the treatment of human nasopharyngeal cancer
Abstract
Activation of Notch signaling pathway in cancer stem cells plays a crucial role in the regulation of self-renewal and maintenance of side population cells. In the present study, we have identified cancer stem like 2.7% side population cells from nasopharyngeal carcinoma samples whose prevalence was significantly reduced to 0.3% upon verapamil treatment. The protein level of Notch1 and Hes-1 are highly up-regulated in fluorescence-activated cell sorting purified side population cells and thus leads to the elevated expression of stem cell surface proteins (Oct-4, Sox2 and Nanog), which are essential for side population cells self-renewal. In addition, these nasopharyngeal carcinoma side population cells are CD133 and CD44 positive and they possess enhanced cell proliferation rate, highly tumorgenic and invasive. Our findings suggest that Notch1 signaling is a potential target of novel anticancer drugs, which could efficiently target and eradicate the cancer stem cells.
Introduction
Nasopharyngeal carcinoma is one of the most common cancers originate from the upper region of pharynx, occurs in both men and women among worldwide. Despite recent advances in treatment strategy, still patients are suffering from therapy failure, tumor recurrence and metastasis.
According to the concept of cancer stem cell theory, tumors are heterogeneous and they contain small subpopulation of cells, which have indefinite life span, are termed as cancer stem cells. These cancer stem cells play a major role in tumorigenesis and also responsible for resistance to cancer therapies and tumor recurrence (Kawasaki et al., 2008). Several studies showed that cancer stem cells are highly self-renewal, possess differentiation potential, express stem cell surface proteins (e.g., CD24, CD44 and CD133), chemo- and apoptosis resistance. However, the molecular mechanism and signaling pathways behind the cancer stem cells mediated tumorigenesis is not clear. So far, studies in different cancers showed that Wnt/alpha-catenin and Notch signaling play a crucial role in self-renewal and maintenance of cancer stem cells. Notch signaling is highly activated in cancer stem cells and thus leads to the over expression of stem cell proteins which contributed to rapid propagation of cancer stem cells (Pannuti et al., 2010; Wang et al., 2005; Zhang et al., 2010; Teng et al., 2010; Bao et al., 2006). Studies also demonstrated in nasopharyngeal carcinoma cell line that inactivation of Notch signaling leads to increased sensitivity of nasopharyngeal carcinoma side population cells towards to radio- and chemotherapy resistance (Phillips et al., 2006; Woodward et al., 2007; Yu et al., 2012). Therefore, identification of the factors and signaling pathways involved cancer stem cells mediated therapy failure and tumor relapse is a crucial one to improve the treatment regimen.
Side population cells have been identified and characterized in several solid tumors, including glioblastoma, gastrointestinal system tumor, head and neck squamous carcinoma, hepatocellular cell lines, and also in primary cultures from neuroblastoma patients (Kondo et al., 2004; Haraguchi et al., 2006; Hirschmann-Jax et al., 2004; Chiba et al., 2006; Chen et al., 2006). However, the studies concerning the side population cells of human nasopharyngeal carcinoma is very less. Therefore, exploration of cancer stem like side population cells from nasopharyngeal carcinoma and targeting its key signaling pathways will be worth to develop new anticancer drugs to eliminate the minimal residual disease. The presence of side population cells from nasopharyngeal carcinoma for activation of Notch signaling pathways was investigated.
Materials and Methods
Sample collection and cell culture
Nasopharyngeal carcinoma samples were collected at the time of surgery according to the ethical approval. The details of samples: number of patients (n=15); stage "III-IV; region" infratemporal. The cancer tissues were washed extensively in PBS solution containing antibiotics and incubated overnight in DMEM/F12 (GIBCO) containing penicillin (500 U/mL), streptomycin (500 ug/mL), and amphotericin B (1.25 ug/mL) (GIBCO). Enzymatic digestion was performed using collagenase (1.5 mg/mL) (GIBCO) and hyaluronidase (20 ug/mL) in PBS for 1 hour. Cells were cultured in DMEM with 10% FBS, supplemented with antibiotics and maintain in T-75 flasks at 37ºC in a humidified 5%CO2 and 95%air atmosphere. Cells on becoming 90% confluent are removed from culture flask using Trypsin-EDTA (0.25% - 53 mM EDTA) washed, cells suspended in 10% DMEM. Cell count was taken using hemocytometer.
Labeling with Hoechst 33342
Study groups
Control cells + Hoechst 33342 (n=3); Drug treated cells + verapamil + Hoechst 33342 (n=3). Cells in staining medium (approx 106 cells/mL of 10% DMEM) are labeled with Hoechst 33342 stock (sigma)-bis-benzimide (5 uL/mL) either with dye alone or in combination with drug (verapamil - 0.8 uL/mL). The cells were mixed and placed in water bath at 37ºC for 90 minutes exactly. After 90 min, cells were spin down (2,000 rpm for 10 min at 4ºC) and resuspended in 500 uL of HBSS containing 10 mM HEPES. Finally, counter stained the cells with PI (propidium iodide) 2 ug/mL sample at 4ºC. Cells were filtered through a 50 um nylon mesh (BD) to remove cell clumps into labeled FACS tubes. Separate tubes with medium (10% DMEM) were kept for sterile sorting of side population cells and main population cells. The cells were sorted using a flow cytometer (FACS Aria II; BD Biosciences; Franklin Lakes, NJ, USA). The Hoechst 33342 dye was excited at 355 nm and its dual-wavelength fluorescence was analyzed (blue, 450 nm; red, 675 nm).
Real-time reverse transcription (RT)-polymerase chain reaction (PCR)
Total RNA was extracted and complementary DNA was prepared using reverse transcriptase kit (Fermentas). Real-time RT-PCR analysis was subsequently performed on an iCycler IQ real-time detection system (BioRad), using IQ Supermix with SYBR-Green (BioRad). Reactions were carried out in triplicate. The primer sequence used fir Notch1 and Hes-1 and methods were used as described previously (Yu et al., 2011). The primer sequences for other gene (Guo et al., 2012) were used as follows: ABCG2 - (F: GGA TGA GCC TAC AAC TGG CTT and R: CTT CCT GAG GCC AAT AAG GTG); Oct4 – (F: TCG AGA ACC GAG TGA GAG GC and R: CAC ACT CGG ACC ACA TCC TTC); Sox2 - (F: CAC ACT GCC CCT CTC ACA CAT and R: CAT TTC CCT CGT TTT TCT TTG AA); Nanog - (F: CCA ACA TCC TGA ACC TCA GCT AC and R: GCC TTC TGC GTC ACA CCA TT); GAPDH - (F: TCT GCT CCT CCT GTT CGA CA and R: AAA AGC AGC CCT GGT GAC C). GAPDH is used as a house keeping genes. The PCR parameters used to set PCR reactions are: Initial denaturation -95ºC for 15 sec; annealing - 58ºC for 45 sec; extension -60ºC for 30-45 sec; cycles - 35. The data represented in the graph are the average values of three independent experiments.
Western blot analysis
For Western blot analysis, proteins were extracted from the side population and non-side population cells, and protein concentration was determined using the Bradford assay. Following sodium dodecyl sulfate- polyacrylamide gel electrophoresis (SDS-PAGE) and transfer to a membrane, the gels were treated with the primary antibodies (rabbit anti-human) for Notch1 intracellular domain (NICD) antibody (1:5000), ABCG2 (1:10000), GAPDH (1:10000) and mouse anti-human Hes-1 antibody (1:500). Subsequently, the cells were treated with the secondary antibody (goat anti-rabbit IgG with alkaline phosphatase markers) and a chemiluminescence reagent. Blots were detected and scanned by using a densitometer (Biorad GS-710). Equal concentration of the proteins was loaded per lane and GAPDH is used as a loading control.
Clone formation efficiency
The sorted side population and non-side population cells were placed at a density of 1,000 cells/mL resuspended in tumor sphere medium consisting of serum-free 1:1 mixture of Ham's F-12/DMEM, N2 supplement, 10 ng/mL human recombinant bFGF, and 10 ng/mL EGF and subsequently cultured in ultralow attachment plates for about 2 weeks. SP and non-SP cells sorted were seeded at a low density of 20 cells/L and the number of generated spheres (>100 mL) was counted after 7 days of culture. The values represented in the graph are the average values of three independent experiments.
Immunofluorescent staining
The sorted side population cells and main population cells were seeded in 35 mm culture plates (approximately 100 µL). Kept in incubitor for 3 hours and 1 mL of medium (10% DMEM) was given. After overnight incubation, the cells were rinsed with PBS and fixed in 4% PFA (Para formaldehyde) in 1x PBS, for 5 min at 4°C. After washing with 1x PBS, cells were blocked with 1% BSA-TBS with RNase (conc: 10 µL/1000 µL of 3% BSA-TBS). After 1 hour incubation at room temperature, rinsed with PBS and primary antibody in 1% BSA-TBS was given (dilution: 1:100; 2 µL/200 µL), incubated overnight at 40°C. After washing with 1x PBS cells were incubated with secondary antibody conjugated with FITC (dilution: 1:100 in 1% BSA-TBS), at room temperature for 1 hour. Again PBS wash was given and propidium iodide was added (1 µL/200 µL of PBS). Then cells were viewed under confocal laser scanning microscope (Leica TCS). Image analysis and figures were prepared using Adobe Photoshop CS4.
In vitro proliferation activity
The sorted side population and non-side population cells were seeded in a 96-well plate at 2 x 10⁶ cells/well and then cultured in a CO2 incubator. Each group was set up in triplicate. Cell proliferation activity was measured every day for 7 days. Each well was supplemented with CCK-8 solution (10 uL) and incubated in CO2 incubator for 2-3 hours. The optical density was determined at 450 nm. These data were used to calculate cell growth graphs based on the mean value of OD450 and standard deviation values for each well.
Differentiation assay
The differentiation assay was performed as per the previously described protocol (Ho et al., 2007). After 16-18 days of cell sorting, cells were cultured in normal RPMI 1640 and they were subjected to determine the differentiation ability of the two subpopulations under the microscope.
Martigel invasion assay
Cellular invasiveness of side population and non-side population cells was determined by using six-well Matrigel invasion chambers (BD Biosciences Discovery Labware). Cells were seeded in serum free medium at a density of 2 x 10⁵ per insert. Outer wells were filled with DMEM containing 5% FBS as chemoattractant and incubated at 37°C for 48 hours. Subsequently, the non-invading cells were washed by swabbing top layer of Matrigel with Q-tip (Ho et al., 2007). Membrane containing invading cells was stained with hematoxylin for 3 min, washed, and mounted on slides. The entire membrane with invading cells was counted under light microscope at 40x objective. The values represented in the graph are the average value of three independent experiments.
Cell resistance assay
Approximately 1 x 10³ cells/plate were cultured in 96-well plates and treated with the chemotherapeutic drugs at the following concentrations: 5-fluorouracil (5-FU) with a concentration of 10 ug/mL, gemcitabine 250 mM, oxaliplatin (100 mM), paclitaxel 30 ng/mL, cisplatin 5 mg/mL, etoposide 10 mg/mL and oxaliplatin (2 ug/mL 100). The mean value of OD450 obtained was represented as a graph. Cell resistance in both groups was calculated using the following formula: Cell resistance rate (%) = (experimental group OD450 value/control group OD450 value) x 100. The values presented in the graph are the average of three independent experiments.
Statistical analysis
One-way analysis of variance (ANOVA) and student's t-test was performed to determine the significant difference between the treatment and control groups. A probability level of p<0.05 or 0.01 was considered as statistically significance. The difference was considered statistically significant at p<0.05 or p<0.01.
Results
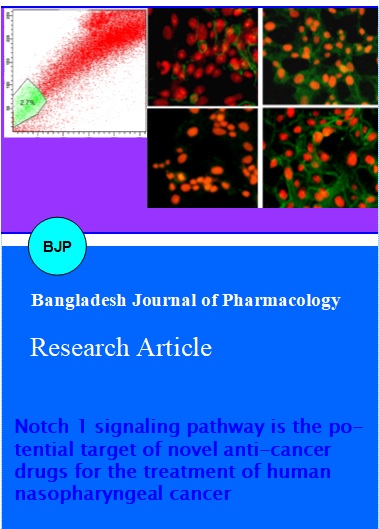
The distinct side population cell population of about 2.7% (Figure 1A, gated region) found towards the side population-violet region of the dot plot of the FACS profile. After treatment with verapamil (ABC transporter inhibitor), the percentage of side population cells was significantly reduced to 0.3% (Figure 1B, gated region). These data clearly indicates that the property of dye exclusion by side population cells actively involves ABC transporter proteins and that was confirmed by treatment of side population cells with verapamil where the side population cells were significantly diminished (Figure 1C). Therefore, the side population cells are highly resistant to drug uptake due to the over expression of ABC transporter proteins (Figure 1D and E).
Figure 1: Analysis of side population (SP) cells in nasopharyngeal carcinoma (NPC). A. Cells were stained using Hoechst 33342 dye and analyzed using flow cytometry. SP cells are outlined (gated population) and also shown as a percentage of the total cell population. B. The percentage of SP cells was significantly reduced to o.3% in the presence of verapamil. C. Graphical representation for presence of SP cells with and without verapamil treatment. Quantitative graph made from the dot blot analysis by FACS. D. RT-PCR and western blot (E) analysis showing elevated expression of ABCG2 in SP cells
The Western blot analysis revealed that NCID and Hes-1 are highly expressed in side population cells than non-side population cells (Figure 2A). Further, by RT-PCR. The relative mRNA expression of Notch1 and Hes-1 were significantly higher in side population cells (Figure 2B).
Figure 2: Notch signaling activation in side population (SP) cells. A. The quantification graph from RT-PCR analysis showing the elevated mRNA expression of Notch1 and Hes-1 in SP cells. B. Western blot showing the increased protein expression of NCID and Hes-1 in SP cells than non-SP cells. Equal concentration of proteins was loaded per lane. GAPDH was used as a house keeping gene and loading control
As shown in the graph (Figure 3A), the side population cells can able to generate more number of spheres rapidly than non-side population cells. The size of the tumor spheres was gradually increased with time (data not shown). Thus, confirms that side population cells were highly self-renewal. The expression of Oct-4, Nanog and Sox2 were found to be up-regulated in SP cells (Figure 3B). The immunofluoresence assay revealed that these side population cells were highly positive to stem cell proteins CD133 and CD44 than non-side population cells (Figure 3C).
Figure 3: Side population (SP) cells were more tumorigenic and self-renewal. A. Clone formation efficiency of SP cells. The total number tumor spheres generated by NPC SP cells are significantly higher than non-SP cells. B. The quantification graph of RT-PCR analysis showing that the relative mRNA expression of Oct-4, Sox2 and Nanog are significantly higher in SP cells compared to non-SP cells. C. Fluorescence microscopic analysis of stem cell surface markers. SP cells (almost entire population) showed fluorescence positive for the presence of CD133 and CD44 whereas this fluorescence are not enriched in non-SP. The bar represents the standard deviation (**p< 0.01).
The sorted side population cells (Figure 4A) underwent rapid cell proliferation starting from the 3rd day itself and become more confluent on 7th day. However, the growth rates of non-side population cells are significantly low when compared side population cells (Figure 4A). Similarly, the side population cell morphology was changed remarkably and started to lost their normal appearance after day 5, and after 7 days side population cells began to extend fibroblast-like filaments. These striking features were not observed significantly in non-side population cells (Figure 4B).
Figure 4: Side population (SP) cells are high potent of proliferation and differentiation. A. Cell proliferation rate of SP cells are significantly higher than and non-SP cells. The x-axis represents time, while the y-axis indicates the corresponding optical density (OD) value at 450 nm. B. The cell morphology of FACs sorted SP cells changes rapidly after culturing of 5 days. Later (day 7), the SP cells developing many long filaments resembling fibroblast but not in non-SP cells. The bar represents the standard deviation (*p<0.05; **p<0.01)
In vitro matrigel invasion assay revealed that FACs purified side population cells are significantly more invasive than non-side population cells (Figure 5A). Subsequently, the side population cells showed increased resistance to multidrugs such as etoposide, gemcitabine, 5-flurouracil, cisplatin, paclitaxel and oxaliplatin. Upon treatment with these drugs, the survival rate of side population cells were significantly higher than non-side population cells (Figure 5B) due to over expression of ABCG2 and also possibly by reduced apoptosis.
Figure 5: Side population (SP) cells are chemoresistance and highly invasive. A. Comparison of cell survival rate of side population (SP) cells and non-SP cells after treatment with the drugs such as etoposide, gemcitabine, 5‑fluorouracil (5-FU), cisplatin, paclitaxel and oxaliplatin. The SP showed increased resistance to these drugs and their survival rate are higher (more than 80%) than non-SP cells. B. SP cells invasiveness as measured by the Matrigel assay. SP and non-SP cells (4 x 10⁵) were seeded and incubated for 72 hours. Graph representing the number of cells invaded across the membrane. The bar represents the standard deviation, **p<0.01.*p<0.05
Discussion
Cancer stem cells are the major cause for chemotherapy resistance, tumor relapse and metastasis. Accumulating evidences suggested that identification and characterization of rare, small population of cancer stem like side population cells helps to target the cancer stem cells in order to eliminate the tumor refractory. Side population cells of NPC cell line are highly proliferative, self-renewal, differentiation and tumorigenic (Wang et al., 2007) and therefore they are considered as enriched side population. The present study showed the presence of side population cells in nasopharyngeal carcinoma samples and they strongly resist several chemotherapeutic drugs due to enhanced expression of ABC transporter ABCG2 and possibly by reduced rate of apoptosis. The multidrug resistance phenomenon shown by these cells enables it to survive the chemotherapy regimen and hence result in poor prognosis in patients suffering from NPC. Further, this study showed that side population cells are highly self-renewal, enhanced cell proliferation rate, tumorigenic and invasive. These side population cells showed elevated mRNA levels of oct-4, sox2 and nanog. In addition, side population cells showed enhanced immuno fluorescence for CD44 and CD133 staining. Previous studies in different types of solid tumors showed that enriched CD147, CD133 on tumor cells induces tumor invasion by over stimulating and stimulates production of several matrix metalloproteinases by adjacent stromal cells (Guo et al., 2000). Similarly, CD44 also proved in the study of head and neck squamous cell carcinomas (HNSCC) that CD44+ cells are highly tumorigenic and they are able to propagate tumor formation in mice, whereas CD44− cells were not (Yanamoto et al., 2007). Notch signaling pathway has been shown to be involved in the self-renewal properties and they are crucial for maintenance of NPC CSCs (Yu et al., 2012). Further, in the Notch depleted cells, the SP cells are more sensitive to chemotherapies and the rate of apoptosis was enhanced. In addition, the self-renewal and high proliferation rate was compromised in the Notch depleted cells. In consistence with the previous studies (Zhang et al., 2004; Fan et al., 2008; Sikandar et al., 2010; Zhen et al., 2010), we also demonstrated that sorted NPC SP cells possess elevated Notch1 pathways as the expression level of NCID, Notch1 and Hes-1 are up-regulated in side population cells. Simultaneously, the activation of Notch1 pathways leads to the over expression of stem cell genes such as Oct-4, Sox2 and Nanong and thus essential for self-renewal property of SP cells. Therefore, Notch1 plays a pivotal role in tumorigenesis, self-renewal and maintenance of side population cells in addition to stem cell maintenance and differentiation during embryonic and adult development (Artavanis et al., 1999; Lino et al., 2010). Similar to Notch1, it was shown that Hedgehog (Hh) and Wnt, are the other key factors involved in the regulation of self-renewal of cancer stem cells in different cancers (Kawasaki et al., 2008). Most likely, all these pathways collectively elevated and function together in side population cells. Therefore, the good therapeutic approach is to design novel anticancer drugs that could able to inhibit all these critical pathways essential for the regulation of cancer stem cells in nasopharyngeal carcinoma.
References
Artavanis-Tsakonas S, Rand MD, Lake RJ. Notch signaling: Cell fate control and signal integration in development. Science 1999; 284: 770-76.
Bao S, Wu Q, McLendon RE, Hao Y, Shi Q, Hjelmeland AB, Dewhirst MW, Bigner DD, Rich JN. Glioma stem cells promote radioresistance by preferential activation of the DNA damage response. Nature 2006; 444: 756-60.
Chen JS, Pardo FS, Wang-Rodriguez J, Chu TS, Lopez JP, Aguilera J, Altuna X, Weisman RA, Ongkeko WM. EGFR regulates the side population in head and neck squamous cell carcinoma. Laryngoscope 2006; 116: 401-06.
Chiba T, Kita K, Zheng YW, Yokosuka O, Saisho H, Iwama A, Nakauchi H, Taniguchi H. Side population purified from hepatocellular carcinoma cells harbors cancer stem cell-like properties. Hepatology 2006; 44: 240–51.
Fan X, Khaki L, Zhu TS, Soules ME, Talsma CE, Gul N, Koh C, Zhang J, Li YM, Maciaczyk J, Nikkhah G, Dimeco F, Piccirillo S, Vescovi AL, Eberhart CG. NOTCH pathway blockade depletes CD133-positive glioblastoma cells and inhibits growth of tumor neurospheres and xenografts. Stem Cells 2010; 28: 5-16.
Guo D, Xu BL, Zhang XH, Dong MM. Cancer stem-like side population cells in the human nasopharyngeal carcinoma cell line CNE-2 possess epithelial mesenchymal transition properties in association with metastasis. Oncol Rep. 2012; 28: 241-47.
Guo H, Li R, Zucker S, Toole BP. EMMPRIN (CD147), an inducer of matrix metalloproteinase synthesis, also binds interstitial collagenase to the tumor cell surface. Cancer Res. 2000; 60: 888-91.
Haraguchi N, Utsunomiya T, Inoue H, Tanaka F, Mimori K, Barnard GF, Mori M. Characterization of a side population of cancer cells from human gastrointestinal system. Stem Cells 2006; 24: 506-13.
Hirschmann-Jax C, Foster AE, Wulf GG, Nuchtern JG, Jax TW, Gobel U, Goodell MA, Brenner MK. A distinct “side population†of cells with high drug efflux capacity in human tumor cells. Proc Natl Acad Sci USA. 2004; 101: 14228–33.
Ho MM, Ng AV, Lam S, Hung JY. Side population in human lung cancer cell lines and tumors is enriched with stem-like cancer cells. Cancer Res. 2007; 15; 67: 4827-33.
Kawasaki BT, Hurt EM, Mistree T, Farrar WL. Targeting cancer stem cells with phytochemicals. Mol Interv. 2008; 8: 174-84.
Kondo T, Setoguchi T, Taga T. Persistence of a small subpopulation of cancer stem-like cells in the C6 glioma cell line. Proc Natl Acad Sci USA. 2004; 101: 781-86.
Lino MM, Merlo A, Boulay JL. Notch signaling in glioblas¬toma: A developmental drug target. BMC Med. 2010; 8: 72.
Pannuti A, Foreman K, Rizzo P, Osipo C, Golde T, Osborne B, Miele L. Targeting Notch to target cancer stem cells. Clin Cancer Res. 2010; 16: 3141-3152.
Phillips TM, McBride WH, Pajonk F. The response of CD24(-/low)/CD44+ breast cancer-initiating cells to radiation. J Natl Cancer Inst. 2006; 98: 1777-85.
Robinson SN, Seina SM, Gohr JC, Kuszynski CA, Sharp JG. Evidence for a qualitative hierarchy within the Hoechst-33342 ’side population’ (SP) of murine bone marrow cells. Bone Marrow Transplant. 2005; 35: 807-18.
Sikandar SS, Pate KT, Anderson S, Dizon D, Edwards RA, Waterman ML, Lipkin SM. NOTCH signaling is required for formation and self-renewal of tumor-initiating cells and for repression of secretory cell differentiation in colon cancer. Cancer Res. 2010; 70: 1469-78.
Teng Y, Wang X, Wang Y, Ma D.Wnt/β-catenin signaling regulates cancer stem cells in lung cancer A549 cells. Biochem Biophys Res Commun. 2010; 12; 392: 373-79.
Wang J, Guo LP, Chen LZ, Zeng YX and Lu SH. Identification of cancer stem cell-like side population cells in human nasopharyn¬geal carcinoma cell line. Cancer Res. 2007; 67: 3716-24.
Wang M, Li JT, Zeng YX, Hou JH, Lin QQ. Expression and significance of Notch1, p21WAF1 and involucrin in nasopharyngeal carcinoma (In Chinese). Ai Zheng. 2005; 24: 1230-34.
Woodward WA, Chen MS, Behbod F, Alfaro MP, Buchholz TA, Rosen JM. WNT/beta-catenin mediates radiation resistance of mouse mammary progenitor cells. Proc Natl Acad Sci USA. 2007; 104: 618-23.
Yanamoto S, Kawasaki G, Yoshitomi I, Iwamoto T. Clinicopathologic significance of EpCAM expression in squamous cell carcinoma of the tongue and its possibility as a potential target for tongue cancer gene therapy. Oral Oncol. 2007; 43: 869-77.
Yu S, Zhang R, Liu F, Hu H, Yu S, Wang H. Down-regulation of Notch signaling by a γ-secretase inhibitor enhances the radio-sensitivity of nasopharyngeal carcinoma cells. Oncol Rep. 2011; 26: 1323-28.
Yu S, Zhang R, Liu F, Wang H, Wu J, Wang Y. Inhibition suppresses nasopharyngeal carcinoma by depleting cancer stemlike side population cells. Oncol Rep. 2012; 28: 561-66.
Zhang XP, Zheng G, Zou L, Liu HL, Hou LH, Zhou P, Yin DD, Zheng QJ, Liang L, Zhang SZ, Feng L, Yao LB, Yang AG, Han H, Chen JY. Notch activation promotes cell proliferation and the formation of neural stem cell-like colonies in human glioma cells. Mol Cell Biochem. 2008; 307: 101-08.
Zhang Y, Peng J, Zhang H, Zhang H, Zhu Y, Wan L, Chen J, Chen X, Lin R, Li H, Mao X, Jin K. Notch1 signaling is activated in cells expressing embryonic stem cell proteins in human primary nasopharyngeal carcinoma. J Otolaryngol Head Neck Surg. 2010; 39: 157-66.
Zhen Y, Zhao S, Li Q, Li Y, Kawamoto K. Arsenic trioxide-mediated Notch pathway inhibition depletes the cancer stem-like cell population in gliomas. Cancer Lett. 2010; 292: 64-72.
Zhou S, Morris JJ, Barnes Y, Lan L, Schuetz JD, Sorrentino BP. Bcrp1 gene expression is required for normal numbers of side population stem cells in mice, and confers relative protection to mitoxantrone in hematopoietic cells in vivo. Proc Natl Acad Sci USA. 2002; 99: 12339-44.
Zhou S, Schuetz JD, Bunting KD, Colapietro AM, Sampath J, Morris JJ, Lagutina I, Grosveld GC, Osawa M, Nakauchi H, Sorrentino BP. The ABC transporter Bcrp1/ABCG2 is expressed in a wide variety of stem cells and is a molecular determinant of the sidepopulation phenotype. Nat Med. 2001; 7: 1028-34.