Condensation reaction of benzil with resorcinol and the establishment of the spectral data as well as cytotoxicity study
Abstract
Condensation of benzil, 1 with resorcinol in the presence of potassium carbonate at 110-120°C gave the mixture of the compounds. Using various kinds of separation technique only five types of the polymeric products, a1, a2, a3, a4 and a5 were isolated. The compounds a1, a4 showed high cytotoxic activity and the compounds a2, a3 and a5 showed relatively low cytotoxic activity against the brine shrimp lethality bioassay.
Introduction
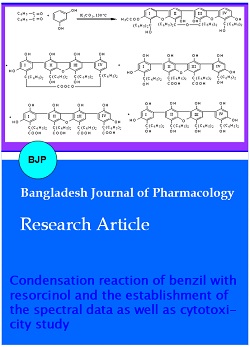
Various types of substituted heterocyclic compounds were synthesized and cytotoxic activity of these compounds have been found by screening tests (Islam et al., 2001a; Islam et al., 2001b; Lingcon et al., 2001). To compare the cytotoxic activity of the titled compounds in scheme 1 have been isolated and sent for screening tests whether they can show reasonable lethal effect on brine shrimp (Anderson et al., 1999) or not. The compounds that are mentioned have been furnished in Scheme 1 with Flowchart 1.
Scheme 1
Flow Chart
Materials and Methods
Melting points were not corrected. IR spectra were recorded on a Shimadzu DR 8001 FT-IR spectrometer, NMR spectra on a WP 200 spectrometer using TMS as internal standard and mass spectra on an MS Kratas mass spectrometer.
Reaction
Benzil (0.01 moles or 2.10 g), resorcinol (0.005 moles or 0.55 g) and potassium carbonate (0.015 moles or 2.07 g) were mixed and heated in three necked quick-fit round bottom flask in the oil bath at 110-120°C. Heat was continued until all the solids were melted to liquid and this liquid was heated for half an hour. CO2 was evolved and this liquid was converted into colored solid mass. This solid contains mixture of compounds (Hans et al., 1905), PM that was examined on TLC.
Extraction of the compound (a1)
Chloroform was mixed to the water-soluble portion and shaken half an hour. Two layers were formed. Lower layer was organic layer and upper layer was aqueous layer. Thus yellow organic layer was collected in several times and dried over anhydrous Na2SO4. This organic layer was evaporated and it gives a single product, a1, m.p. 110 - 13ºC. Its color is red. IR: ν Nujol (cm-1) 3500-2500 (b, H bonded OH of COOH); 2955, 2926 (νC-H); 1605 (b, νC=O); 1207 (b, νC-O stretching). 1H-NMR (DMSO): δ 10.20-9.80 (b, COOH), δ 8.50-8.20 (b, OH), 8.00-6.00 (m, C-H, aromatic protons). 13C-NMR (DMSO): δ 195.20 (C-1); δ 135.93 (C-10), δ 132.59 (C-8), δ 131.11 (C-7), δ 129.97 (C-11), d 129.89 (C-3), d 129.62 (C-15), d 129.33 (C-6), d 129.21 (C-4), d 128.90 (C-5), 128.00 (C-12) and δ 70.56 (C-9). Mass: m/z (% of relative intensity) 1256.0 (M+., 2%), 873.0 (15%), 677.0 (55%), 225.1 (6%), 154.0 (10%) and 105.0 (100%). The molecular ion peak appears at m/z 1256 due to C80H56O15.
Separation of the product (a2)
The product, a2 was dried in desiccator and gave single spot on TLC examination, m.p. 258-60ºC. The color of the compound was light brick red. IR: ν Nujol (cm-1) 3200-3600 (s, b, νOH); 3087, 3056 (s, νC-H, aromatic); 1732, 1600 (νC=O); 1565, 1547 (νC=C, aromatic rings); 1212 (νC-O).
Isolation of the compound (a3)
After collecting the PLDM product, this portion was separated by column chromatography on silica gel using pet ether and ethyl acetate. 0.639 g was taken for separation. Different fractions were recorded and then later were evaporated. TLC examinations were shown in Table I.
Table I: Several fractions that were recorded during column chromatography
| Fractions | Color | TLC examination and Rf value |
|---|---|---|
| 1st fraction (1-5) | ---- | ---- |
| 2nd fraction (6-13) | Light yellow | One spot, 0.73, benzil (reactant) |
| 3rd fraction (14-18) | Light orange | Three spots having reactant |
| 4th fraction (19-29) | Orange yellow | One spot, 0.35 |
| 5th fraction (30-34) | Light green | One spot with tailing |
| 6th fraction (35) | Slightly yellow | Two spot, 0.35, 0.81 |
| 7th fraction (36-42) | Yellow orange | Three spots with tailing |
| 8th fraction (43-48) | Light yellow orange | Three spots having too much tailing |
Table II: Different bands in TLC
| Name | Amount | Rf value |
|---|---|---|
| 1st band | Trace amount | Discarded |
| 2nd band | 3 mg | Three spots with tailing |
| 3rd band | 4 mg | One spot, 0.81 |
Table III: Different fractions that were recorded during column chromatography
| Fraction no | Test tube no | Color | Amount | TLC exam. & Rf value |
|---|---|---|---|---|
| 1st fraction | 4-Jan | ---- | ---- | ---- |
| 2nd fraction | 10-May | Light yellow | 0.05 g | 0.95, it may reactant (benzil) |
| 3rd fraction | 18-Nov | Reddish | 0.08 g | 0.95, 0.90 |
| 4th fraction | 19-21 | Brown | 0.03 g | 0.90, one spot with tailing |
| 5th fraction | 22-28 | Red | 0.10 g | Too many spots |
| 6th fraction | 29-50 | Deep red | 0.15 | Too many spots |
| 7th fraction | 51-70 | Yellow | 0.17 | Too many spots |
| 8th fraction | 71-90 | Yellow | 0.21 | Too many spots |
Table IV: Different bands in TLC
| Name | Amount | Rf value |
|---|---|---|
| 1st band | Trace amount | Discarded |
| 2nd band | 8 mg | 0.90 (one spot) |
| 3rd band | 5 mg | 0.90, 0.88 tailing |
Identification of the 4th fraction
This portion was orange yellow in color yielded 0.080 gm and m.p 140 - 42ºC. This was designated as a3. IR: ν Nujol (cm-1) 3600-3200 (b, νOH); 3025 (νC-H, aromatic); 1684, 1672 (νC=C, aromatic rings); 1277 (b, νC-O).
Isolation of the compound (a4)
Further separation of the 6th fraction
The 6th fraction in Table I was taken for PTLC method for further separation and pet ether and ethyl acetate were used as solvent (EA:PE=3:2). Three bands were found in Table II.
3rd band that collected was designated as a4. The product was solid (light pink color). IR: ν Nujol (cm-1) 3600 - 3200 (b, νOH (H bonded of COOH) group); 3060, 3028 (νC-H, aromatic); 1799, 1714 (b, νC=O); 1601 (νC=C, aromatic rings); 1277 (b, νC-O stretching).
Isolation of the compound (a5)
After getting the PETR product this portion was separated by column chromatography on silica gel using ethyl acetate and pet ether. 1.0 g was taken for separation. Different fractions were collected and evaporated for the TLC examination, which were given in Table III.
Further separation of the 4th fraction
The 4th fraction was taken for PTLC method for further separation and pet ether and ethyl acetate were used as solvent (EA:PE=5:95). Three bands were found in Table IV.
2nd band was collected and was designated as a5. The product was solid, m.p. 287 - 88ºC.
IR: ν Nujol (cm-1) 3600-3300 (b, νOH, stretching); 3063, 3050 (νC-H, aromatic); 2980 (νC-H, aliphatic); 1809, 1740 (b, νC=O asymmetric and symmetric stretching); 1597, 1581 (νC=C, aromatic rings); 1211 (νC-O). 1H-NMR (DMSO): δ 8.20-8.00 (b, OH, phenol), δ 7.90-7.10 (m, C-H, aromatic protons), δ 6.40-6.20 (s, OH, alcohol), δ 2.30 (s, 3H, CH3, aliphatic). Mass: m/z (% of relative intensity) 677.0 (18%), 483.1 (25%), 307.1 (22%) and 154.0 (100%). The molecular ion peak appears at m/z 1150 due to C78H54O10.
Result and Discussion
The mixture of the products, PM was washed with water and then this water soluble portion was extracted by chloroform and TLC examination of the product, a1 showed the single spot. In the IR spectrum of the compound a1, the broad band at 3500 - 2500 cm-1 points out the presence of H-bonded OH of COOH (i.e., presence of COOH group and OH group of aromatic in H-bonding). The signal at 2955 cm-1 indicates the presence of C-H group in aromatic ring. The value of dH is lowered due the H-bonded. The weak band at 1605 cm-1 identifies C=O group in COOH and the value at 1288 cm-1 indicates the presence of C-O group. In 1H-NMR spectrum, the broad signal (hum) at δ 10.2 - 9.8 is assigned for COOH and the other broad value at d 8.5 - 8.2 indicates the presence of OH group in aromatic. The multiplet at 8.0 - 6.0 shows the presence of the rest of C-H protons in aromatic ring. In 13C-NMR spectrum, the peak at δ 195.20 (C-1) is assigned for the carbonyl group, C=O in COOH. The aromatic carbons are designated by the following values δ 135.93 (C-10), δ 132.59 (C-8), δ 131.11 (C-7), δ 129.97 (C-11), d 129.89 (C-3), d 129.62 (C-15), d 129.33 (C-6), d 129.21 (C-4), d 128.90 (C-5), 128.00 (C-12) and δ 70.56 (C-9). In the mass spectrum, molecular ion peak (M+.2%) appears at m/z 1256 that corresponding to the molecular formula C80H56O15. In this spectrum the base peak is formed at m/z 105.
The product, a2 was obtained from the cold precipitate of DCM soluble portion and this DCM soluble portion was found from ethanol soluble portion of PM. This product gave the single spot on TLC examination. In the IR spectrum of the compound, a2 the broad band at 3600 - 3200 cm-1 indicates the presence of OH group. The signals at 3087 cm-1, 3056 cm-1 indicate the presence of C-H group in aromatic ring. The values at 1732 cm-1, 1600 cm-1 show the presence of C=O group in CO-O-CO. The bands at 1565 cm-1 and 1547 cm-1 indicate the presence of C-H group of aromatic ring. The weak band at 1212 cm-1 also identifies the existence of C-O group.
After collecting the cold filtrate, PLDM of DCM soluble portion that obtained from ethanol soluble portion of PM and this portion (PLDM) was separated by column chromatography on silica gel using pet ether and ethyl acetate. 0.639 gm was taken for separation. Different fractions were recorded and from these fractions, the 4th and 6th fractions were collected. The 4th portion was orange yellow colored and this portion was designated as a3. In the IR spectrum of the compound, a3 the broad band at 3600 - 3200 cm-1 indicates the presence of OH group. The signal at 3025 cm-1 indicates the presence of C-H group in aromatic ring. The bands at 1684 cm-1 and 1672 cm-1 indicate the presence of C-H group in aromatic ring. The weak band at 1277 cm-1 also identifies the existence of C-O group.
The 6th fraction was taken for PTLC method for further separation. Pet. ether and ethyl acetate were used as solvents (EA:PE=3:2). Here 3 bands were found. 3rd band that collected was designated as a4. The product was light pink color. In the IR spectrum of the compound a4 the broad band at 3600 - 3200 cm-1 indicates the presence of OH group. The signals at 3060 cm-1, 3028 cm-1 indicate the presence of C-H group in aromatic ring. The values at 1799 cm-1 and 1714 cm-1 show the presence of C=O group in COOH. The band at 1601 cm-1 indicates the presence of C-H group of aromatic ring. The weak band at 1277 cm-1 also identifies the existence of C-O group.
After getting the ethanol insoluble portion, PETR this portion was separated by column chromatography on silica gel using ethyl acetate and pet ether. 1.0 gm was taken for separation. Different fractions were recorded, from these fractions only 4th fraction was collected and it was taken for PTLC method for further separation. Pet.ether and ethyl acetate were used as solvents (EA:PE=5:95). Here 3 bands were found. 2nd band was collected that designated as a5. In the IR spectrum of the compound, a5 the broad band at 3600 - 3300 cm-1 indicates the presence of OH group. The signals at 3063 cm-1, 3050 cm-1 indicate the presence of C-H group in aromatic ring. The value at 2980 cm-1 shows the presence of C-H in saturated aliphatic. The bands at 1809 and 1740 cm-1 indicate the presence of C=O group (asymmetric and symmetric stretching). The values at 1597 and 1581 cm-1 exhibit C=C group in aromatic ring. The sharp band at 1211 cm-1 also identifies the existence of C-O group. In 1H-NMR spectrum the broad peak shows the singlet at δ 8.2 - 8.0 which would be assigned for OH protons of phenol type compounds. The multiplet at d 7.9 - 7.1 indicates the presence of C-H protons in aromatic rings. The two singlets at d 6.3 and d 6.2 indicate the presence of two OH groups. The singlet at 2.3 indicates the presence of CH3 group in CH3-CO-O. In the MS spectrum of the compound, a5 molecular ion peak (M+.1%) appears at m/z 1150 that corresponding to the molecular formula C78H54O10. In this spectrum the base peak is formed at m/z 154.
Cytotoxicity
Cytotoxicity of all the compounds was measured by brine shrimp lethality bioassay method (Anderson et al., 1999). Cisplatin, a recognized anti-cancer drug was used as reference to compare the efficacy of the synthesized compounds. Compounds a1, a2, a3, a4 and a5 showed significant cytotoxicity. Compounds a1 and a4 showed high cytotoxicity. Compounds, a2, a3 and a5 showed relatively low cytotoxicity. So, these compounds may show antimicrobial, anti-tumor etc. activity.
Acknowledgement
The authors express their sincere thanks to Khurshida Khayer Mamun, Department of Chemistry, Jahangirnagar University, Savar, Dhaka, Bangladesh for supplying 1H-NMR, 13C-NMR and mass-spectra of the compounds from Germany.
References
Anderson JE, Goetz CM, McLaughlin JL, Suffness M. Phytochemical analysis. Oxford University Press, 4th ed. 1991, pp 107-10.
Islam MR, Khayer K, Mahmud MI. Reaction of Isatin with 2-aminothiophenol leading to spiroheterocyclic having anticancer activity. Jahangirnagar Univ J Sci. 2001a; 24: 17-22.
Islam R, Abedin MJ, Khayer K, Islam MR. Synthesis of (5-spiro(5´-methylisatin)-4-acetyl-2-(acetylamino)ΔÂÂ2-,3,4-thiadiazoline and 5-spiro (5´-methylisatin)-4-acetyl-2-(5´-methylisatin-3´-hydrazineo)-ΔÂÂ2-1,3,4-thiadiazoline. Indian J Chem. 2001b; 40B: 240-42.
Lingcon MH, Islam R, Khayer K, Islam MR. Cyclization of substituted indole-2-one-3-thiosemicarbazones to noble heterocyclic systems. J Bangladesh Chem Soc. 2001; 14: 127-32.
Apply citation style format of Bangladesh Journal of Pharmacology
Copyright (c) 2006 M. Rabiul Islam, A. Kashem Liton

This work is licensed under a Creative Commons Attribution-NonCommercial 4.0 International License.
