REN C-5312T, but not C-5434T, correlates to increase serum angiotensin I level in angiotensin II receptor blockers-treated hypertensive patients
Abstract
Renin distal enhancer plays a crucial role in regulating renin gene (REN) expression. REN C-5312T enhancer polymorphism increased enhancer activity. REN C-5434T was also identified which supposed to part of enhancer region. Therefore, this study aimed to investigate contribution of both C-5312T and C-5434T to serum angiotensin I in response to angiotensin II receptor blockers (ARB). C-5312T was identified in 46 hypertensive patients by using multiplex polymerase chain reaction (PCR), while C-5434T by using PCR-restiction fragment length of polymorphism (RFLP). Angiotensin I was measured using enzyme linked immunosorbent assay (ELISA). A significant difference of baseline angiotensin I was observed between -5312CC and -5312CT/TT (p=0.038) as well as the angiotensin I after 5 months of ARB treatment (p=0.008) in -5434CT/TT population, but not REN C-5434T. In conclusion, C-5312T resulted in increased mRNA renin level as consequence of higher enhancer activity not only at the baseline but also after 5 months ARB treatment.
Introduction
Renin-angiotensin system (RAS) critically involved in the control of systemic blood pressure (Castrop et al., 2010; Konoshita et al., 2014; Makino et al., 2015). Renin, an aspartyl protease that cleaves angiotensinogen to form the decapeptide angiotensin I (Guang et al., 2012; Santos et al., 2012; Makino et al., 2015). Angiotensin receptor blockers (ARB) is one of RAS inhibitor agents clinically proven to provide many benefits and are widely used in clinical practice (Mancia et al., 2007). If RAS is blocked by the ARB, a feedback mechanism will occur followed by increased renin activity that lead to a compensatory increase in renin release (Cagnoni et al., 2010; Chen et al., 2010). This feedback mechanism was further enhanced the renin level in genetic variant of REN C-5312T hypertensive patients on 5 months of ARB administration, as shown in our previuos study (Rohman et al., 2015).
REN C-5312T was known as part of distal enhancer element (nucleotides -5777 to -5312) which has been reported to activate the human renin promoter approximately 60-fold in primary cultures of human chorionic cells (Germain et al., 1998; Fuchs et al., 2002). Inspite of REN C-5312T, REN C-5434T was identified in this study, which suppose to affect enhancer activity (Maslahah et al., 2015).
Therefore, this study aimed to investigate contribution of REN C-5312T and C-5434T polymorphism to the change of serum angiotensin I level in ARB-treated hypertensive patients.
Materials and Methods
Subjects
Forty six patients with documented hypertension, serum creatinine <2.5 mg/dL and good medication adherence were recruited to this study. Then blood sample was taken at sitting position in the morning for detecting polymorphism and measuring serum angiotensin I levels in the beginning of therapy and after receiving ARB for five months.
DNA Extraction
DNA was extracted from blood samples using gSYNCTM DNA Isolation Kit (Geneaid) according to the manufacturer instruction. Two hundreds microliters of whole blood and 20 uL of proteinase K were placed into a 1.5 mL microcentrifuge tube then mixed by pipetting. The mixture was incubated at 60ºC for 5 min. Cell lysis was achieved by adding 200 uL of GSB buffer to the mixture then mixed by shaking vigorously. The cell lysate was incubated at 60ºC for 5 min. Then, 200 uL of absolute ethanol was added to sample lysate and mixed by shaking vigorously for 10 sec. All of the mixture (including any insoluble precipitate) was transferred to a GD column which placed in a 2 mL collection tube and then centrifuged at 14,000 xg for one min. Afterwards, the 2 mL collection tube containing the flow-through was discarded and transferred the GD column to a new 2 mL collection tube. Then, 400 uL W1 buffer was added to the GD column then centrifuged at 14,000 xg for 30 sec. The flow-through was discarded and the GD column was placed back in a new 2 mL Collection tube. The GD column was washed by adding 600 uL wash buffer then centrifuged at 14,000 g for 30 sec. After centrifuging, the flow-through was discarded and placed back in a new 2 mL collection tube. To dry the column matrix, the GD column was centrifuged at 14,000 x g for 3 min. For elution, the dried GD column was transferred to a clean 1.5 mL microcentrifuge tube and added by 200 uL elution buffer and then centrifuged at 14,000 xg for 30 sec. The samples were stored frozen at -20ºC. To make sure the DNA were isolated, the products were viewed in 1.5% agarose gel stained with ethidium bromide and and photographed under UV illumination.
Detection of C-5312T polymorphism
Renin gene amplification was assayed by multiplex polymerase chain reaction (PCR) using Takara PCR Thermal Cycler. PCR reaction was carried out in 20 µL mixture containing 5 µL of dd H2O, 10 µL of PCR Mix (KAPA2G Robust HotStart ReadyMix PCR Kit), 1 µL of genomic DNA, 1 µL of each primer (sense oligo 5'-CGTAGTGCCATTTTTAGGAAC'-3' and antisense oligo 5'-AACACCAAAGCAGGC-3' with an additional primers was originally designed from the adjacent sequence were the following: sense oligo 5-'GCAGTCTCTGTAAGTGCCAC-3' and antisense oligo 5'-CCAAAGCAGGCTTAATCTCA-3'). The cycling conditions consisted of thirty five cycles of the PCR were performed with the following parameters, denaturation at 95°C temperature for 30 seconds, annealing at a temperature gradient 48-58°C for 30 seconds and extension at 72°C for 1 min followed by a final extension at 72°C for 10 min. Then, the products were viewed in 1.5% agarose gel containing ethidium bromide at 135 voltages for 20 min and photographed under UV illumination. A 100 bp DNA ladder was run alongside to compare the sizes of fragments. Two fragments (376 bp and 160 bp) were produced in the presence of C allele homozygote, two fragments (376 bp dan 265 bp) were produced in the presence of T allele homozygote, and three fragments (376 bp, 265 bp, and 160 bp) were produced in the presence of CT heterozygote (Rohman et al, 2015).
Detection of C-5434T polymorphism
Genomic DNA samples were identified by means of a PCR, followed by a restriction fragment length of polymorphism (RFLP). PCR reaction was carried out in 20 µL mixture containing 7 µL of dd H2O, 10 µL of PCR Mix (KAPA2G Robust HotStart ReadyMix PCR Kit), 1 µL of genomic DNA, 1 µL of each primer (forward 5'-CGTAGTGCCATTTTTAGGAAC-3' and reverse 5'-TTTCTACTTACCAAATGGCGTC-3'). The cycling conditions compromised an initial denaturation step for 3 min at 95°C, followed by 35 cycles consisting of denaturation at 95°C for 30 sec, annealing at 55°C for 30 sec and extension at 72°C for 1 min. A final extension step was performed at 72°C for one min. The amplified fragment was digested with restriction enzyme (Mae II) at 65ºC for 5 hours, electrophoresed on a 1.5% agarose gel stained with ethidium bromide at 100 voltages for 30 min and photographed under UV illumination at 200-400 nm. The presence of C-5434T polymorphism resulted in a loss of the MaeII restriction site (5'-ACGT-3') (Maslahah et al, 2015).
Serum Preparation
The blood samples were collected into covered tube. To separate serum from blood, sample was centrifuged at 3,000 xg for 10 min at 4ºC. The samples were aliquoted into small tubes and stored -80ºC.
Measurement of angiotensin I level
Enzyme linked-immunosorbent assay (ELISA) was used to measure serum angiotensin I levels at the begining and after 5 month of ARB treatment. The frozen samples were thawed at room temperature for a few minutes. Before coating antigen, samples were diluted 1:10 with coating buffer and added to the wells. The plate was incubated at 37ºC for 30 min then placed the plate for incubation at 4ºC overnight. After incubation, the plate was washed thoroughly with washing solutions (100 µL of PBST 0.2%) and 100 µL of blocking buffer was added. Samples in plate were added 100 µL of monoclonal antibody angiotensin I (BGN/KA/22H): sc-80682 and incubated again at 25ºC for 60 min and followed by another washing used washing solutions. One hundred microliter of polyclonal antibody (Biotin-labeled affinity purified polyclonal antibody to mouse IgG) was added. The plate was incubated for 60 min at 25ºC then washed thoroughly with washing solutions and 100 µL of HRP-avidin solution was added. The plate was incubated again at 25ºC for 60 min and followed by another washing used washing solutions. Sixty microliters of tetramethylbenzidine (TMB) solution was added and incubated for 30 min in dark at 25ºC, after which stop solution was then added to each well. Absorbance was recorded immediately on a microplate reader (DIAREADER ELx800 G ELISA) at 450 nm. Serum samples level was calculated from the standard curve and multiplied by the dilution factor.
Statistical analysis
Baseline characteristics, serum angiotensin I level finding between 2 group were compared by independent t-test. Quantitative variables are expressed as mean ± SD values. Categorical variables were compared by the Chi-Squared test. For all tests, a value of p<0.05 was considered as statistically significant. Statistical analysis was performed under the SPSS 16.0.
Results
Baseline characteristics
The baseline characteristics of hypertensive patients between 2 genotype groups; CC and CT/TT of -5312 polymorphism are shown in Table I. Statistical analysis showed that there was no significant differences of baseline characteristics among these two groups. No significant differences also observed regarding the antihypertensive drugs between CC and CT/TT genotype.
Table I: Baseline characteristics-based on REN C-5312T polymorphism
| Variable | Genetic variant of REN C-5312T | p value (a) | |
|---|---|---|---|
| CC (n = 13) |
CT/TT (n = 33) |
p value (a) | |
| Age (years) | 59 ± 6.6 | 58 ± 8.2 | NS |
| Gender (M/F) | 8/5 | 15/18 | NS |
| Ureum (mg/dL) | 25.3 ± 5.5 | 27.4 ± 8.6 | NS |
| Creatinine (mg/dL) | 1.1 ± 0.3 | 0.9 ± 0.2 | NS |
| Cholesterol (mg/dL) | 182.5 ± 44.3 | 188.5 ± 31.3 | NS |
| Blood glucose (mg/dL) | 100.2 ± 10.6 | 94.3 ± 9.6 | NS |
| Body mass index (kg/m2) | 27.2 ± 4.4 | 26.6 ± 3.9 | NS |
| Antihypertensive drug combination (n, %): | |||
| ARB | 1 | 6 | NS |
| ARB, BB | 3 | 8 | NS |
| ARB, CCB | 2 | 6 | NS |
| ARB, BB, CCB | 4 | 3 | NS |
| ARB, BB, HCT | 1 | 4 | NS |
| ARB, CCB, HCT | 2 | 2 | NS |
| ARB, BB, CCB, HCT | 0 | 4 | NS |
| Values are mean ± Standart Deviation of the mean; NS indicates not significant if p>0.05, symbol (a) represent a statistical significance if p<0.05; ARB, angiotensin receptor blocker; BB, beta blocker; CCB, calcium channel blocker; HCT, hydrochlorothiazid | |||
Serum angiotensin I levels between CC and CT/TT genotype of REN-5312 polymorphism
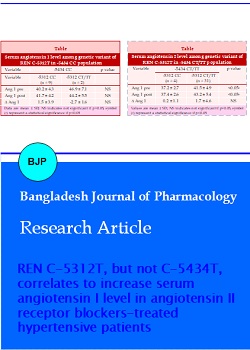
The result performed the analysis of polymorphism not only at C-5312T but also C-5434T of REN. Therefore, 4 groups combination of genotype found considering polymorphism either at -5312 or -5434. 5312CC-5434CC genotype observed in 19.5% of sample, 5312CC-5434CT/TT genotype observed in 8.7% of sample, 5312CT/TT-5434CC genotype observed in 4.4% of sample and 5312CT/TT-5434CT/TT genotype observed in 67.4% of sample. Baseline angiotensin I level was measured and compared between -5312CC and -5312CT/TT hypertensive patients, either in -5434 CC or -5434 CT/TT population as shown in Table II and III.
Table II: Serum angiotensin I level among genetic variant of REN C-5312T in -5434 CC population
| Variable | -5434 CC | p value | |
|---|---|---|---|
| Variable | -5312 CC (n = 9) |
-5312 CT/TT (n = 2) |
|
| Ang 1 pre | 40.2 ± 4.3 | 46.9 ± 7.1 | NS |
| Ang 1 post | 41.7 ± 4.2 | 44.2 ± 5.5 | NS |
| ∆ Ang 1 | 1.5 ± 3.9 | -2.7 ± 1.6 | NS |
| Data are mean ± SD; NS indicates not significant if p>0.05, symbol (a) represent a statistical significance if p<0.05 | |||
Table III: Serum angiotensin I level among genetic variant of REN C-5312T in -5434 CT/TT population
| Variable | -5434 CT/TT | p value | |
|---|---|---|---|
| -5312 CC (n = 4) |
-5312 CT/TT (n = 31) |
||
| Ang 1 pre | 37.2 ± 2.7 | 41.5 ± 4.9 | <0.05a |
| Ang 1 post | 37.4 ± 2.6 | 43.2 ± 5.4 | <0.05a |
| ∆ Ang 1 | 0.2 ± 1.1 | 1.7 ± 4.6 | NS |
| Values are mean ± SD; NS indicates not significant if p>0.05, symbol (a) represent a statistical significance if p<0.05 | |||
No significant difference of baseline angiotensin level was observed among genotype in -5434 CC population. After 5 months treatment of ARB, serum angiotensin I level also revealed no significant difference among genotypes (Table II). In order to know whether there was significant changes of serum angiotensin I level after treatment, post-treatment baseline was calculated. The difference was not statistically significant.
In hypertensive patients carrying -5434 CT/TT, a statistical difference was only identified in baseline and post ARB treatment of angiotensin I level, but not in the changes of angiotensin I level as shown in Table III.
Serum angiotensin I levels between CC and CT/TT genotype of REN-5434 polymorphism
The comparation of serum angiotensin I level among genetic variant of C-5434T REN polymorphism were analyzed, either in hypertensive patients carrying -5312 CC or -5312 CT/TT genotype. Table IV show there was no statistical different of baseline serum angiotensin I level was observed between -5434CC and -5434 CT/TT genotype in -5312 CC population. After 5 months treatment of ARB, angiotensin I level also revealed no significant difference among genotypes as well as the change of angiotensin I level (Table IV).
Table IV: Serum angiotensin I level among genetic variant of C-5434T in 5312 CC population
| Variable | -5312 CC | p value | |
|---|---|---|---|
| -5434 CC (n = 9) |
-5434 CT/TT (n = 4) |
||
| Ang 1 pre | 40.2 ± 4.3 | 37.1 ± 2.7 | NS |
| Ang 1 post | 41.7 ± 4.2 | 37.4 ± 2.6 | NS |
| ∆ Ang 1 | 1.5 ± 3.9 | 0.2 ± 1.1 | NS |
| Values are mean ± SD; NS indicates not significant if p>0.05, symbol (a) represent a statistical significance if p<0.05 | |||
In addition, no statistical difference was found in hypertensive patients carrying -5312 CT/TT, not only in baseline serum angiotensin I level but also after 5 months of ARB treatment and the change of angiotensin I between -5434 CC and -5434 CT/TT genotype (Table V).
Table V: Serum angiotensin I level among genetic variant of C-5434T in 5312 CT/TT population
| Variable | -5312 CT/TT | p value | |
|---|---|---|---|
| -5434 CC (n = 2) |
-5434 CT/TT (n = 31) |
||
| Ang 1 pre | 46.9 ± 7.1 | 41.5 ± 4.9 | NS |
| Ang 1 post | 44.2 ± 5.5 | 43.2 ± 5.4 | NS |
| ∆ Ang 1 | -2.7 ± 1.6 | 1.7 ± 4.6 | NS |
| Values are mean ± SD; NS indicates not significant if p>0.05, symbol (a) represent a statistical significance if p<0.05 | |||
Discussion
Our present study represents the genetic investigation of a possible contribution of REN C-5312T and C-5434T polymorphism to the change of serum angiotensin I level in treated angiotensin II receptor blocker (ARB) Indonesian hypertensive patients. This study has shown that -5312 CT/TT polymorphism resulted in higher angiotensin I level both at baseline and after 5 months ARB treatment compared to -5312 CC hypertensive patients. However, no angiotensin I level changes observed in C-5434T polymorphism at the baseline and after treatment. At the baseline higher level of angiotensin I in -5312 CT/TT individual might be related to increased renin level in this population. Our previous study have shown that a change from T to C causing displacement of Sp1 binding site from center to down-stream of GC rich sequence, and resulted in Sp1 loss of contact with bases -5312, which in turn failure of renin gene stimulating transcription by Sp1 in -5312CC individu (Lukitasari et al., 2011). Coversely, Fuchs et al. (2002) showing 45% greater rates of REN transcription in the presence of a -5312T allele rather than a -5312C allele. So, REN C-5312T polymorphism resulted in increased renin protein level and finally increased angiotensin I as shown by this study.
Previous study showed that there was a significant elevation of serum angiotensin I levels among hypertensive patients with REN C-5312T after receiving valsartan (Konoshita et al., 2009), even if they did not investigate REN C-5434T polymorphism. Angiotensin II receptor blocker (ARB) treatment are associated with feedback loop mechanism that increases renin activity, as loss of stimulation of AT1 receptors on juxtaglomerular cells in the kidney leads to a compensatory increase in renin release. The whole RAAS is, therefore, up-regulated although AT1 receptor-mediated effects of the effector molecule angiotensin II are blocked (Cagnoni et al., 2010). In hypertensive ARB treated patient, REN C-5312T further renin mRNA accumulated in addition to increase renin activity as consequence of feedback loop mechanism. Therefore angiotensin I product also significantly detected higher in REN C-5312T.
Conclusion
REN C-5312T, but not REN C-5434T, polymorphism resulted in increased mRNA renin level as consequence of higher enhancer activity not only at the baseline but also after 5 months ARB treatment.
Ethical Issue
The study was approved by local committee on medical research ethics. Written informed consent was obtained from all study participant.
Acknowledgement
We thank the dedicated hypertension research team who traced participants and collected the data. This paper was supported by Saiful Anwar General Hospital Malang, Indonesia.
References
Cagnoni F, Njwe CAN, Zaninelli A, Ricci AR, Dafra D, D'Ospina A, Preti P, Destro M. Blocking RAAS at different levels: An update on the use of the direct renin inhibitors alone and in combination. Vasc Health Risk Manag. 2010; 6: 549-59.
Castrop H, Hocherl K, Kurtz A, Schweda F, Todorov V, Wagner C. Physiology of kidney renin. Physiol Rev. 2010; 90: 607-73.
Chen L, Soomi K, Eisner C, Oppermann M, Huang Y, Mizel D, Li L, Chen M, Lopez MLS, Weinstein LS, Gomez RA, Schnermann J, Briggs JP. Stimulation of renin secretion by angiotensin II blockade is Gs-alpha-dependent. J Am Soc Nephrol. 2010; 21: 986-92.
Fuchs S, Philippe, J, Germain S, Mathieu F, Jeunemaitre X, Corvol P, Pinet F. Functionality of two new polymorphisms in the human renin gene enhancer region. J Hypertens. 2002; 20: 2391-98.
Germain S, Bonnet F, Philippe J, Fuchs S, Corvol P, Pinet F. A novel distal enhancer confers chorionic expression on the humanrenin gene. J Biol Chem. 1998; 273: 25292-300.
Guang C, Philips RD, Jiang B, Milani F. Three key proteases- angiotensin-I-convertingenzyme (ACE), ACE2 and renin- within and beyondthe renin-angiotensin system. Arch Cardiovasc Dis. 2012; 105: 373-85.
Konoshita T, Kato N, Fuchs S.,Mizuno S, Aoyama C, Motomura M, Makino M, Wakahara S, Inoki I, Miyamori I, Pinet F. Genetic variant of the renin-angiotensin system and diabetes influences blood pressure response to angiotensin receptor blockers. Diabetes Care. 2009; 32: 1485-90.
Konoshita T, Nakaya T, Sakai A, Yamada M, Ichikawa M, Sato S, Imagawa M, Fujii M, Yamamoto K, Makino Y, Arakawa K, Suzuki J, Ishizuka T. Determinants of plasma renin activity: Role of a human renin gene variant as a genetic factor. Medicine. 2014; 93: e354.
Lukitasari M, Rohman MS, Hendrawan D. Achievement of blood pressure target with angiotensin blockage based therapy in outpatient clinic. 5th scientific meeting of Indonesian Society of Hypertension Abstract Book, 2011.
Makino Y, Konoshita T, Omori A, Maegawa N, Nakaya T, Ichikawa M, Yamamoto K, Wakahara S, Ishizuka T, Onoe T, Nakamura H. A genetic variant in the distal enhancer region of the human renin gene affects renin expression. PLoS ONE. 2015; 10: e0137469.
Mancia G, De Backer G, Dominiczak A, Cifkova, Fagard R, Germano G, Grassi G, Heagerty AM, Kjeldsen SE, Laurent S, Narkiewicz K, Ruilope L, Rynkiewicz A, Schmieder RE, Boudier HAJS, Zanchetti A. Guidelines for the management of arterial hypertension: The task force for the management of arterial hypertension of the European Society of Hypertension (ESH) and of the European Society of Cardiology (ESC). J Hypertens. 2007; 25: 1105-87.
Maslahah I, Rohman MS, Widodo N, Endharti AT, Utomo D. Genetic variant of C-5434T REN enhancer on serum renin levels and binding pattern of signal transducers and activators transcription 3. Int J Hypertens. 2015, 2015.
Rohman MS, Satiti IAD, Widodo N, Lukitasari M, Sujuti H. Genetic variants of C-5312T REN increased renin levels and diastolic blood pressure response to angiotensin receptor blockers. Int J Hypertens. 2015, 2015.
Santos PCJL, Krieger JE, Pereira AC. Renin-angiotensin system, hypertension, and chronic kidney disease: Pharmacogenetic implications. J Pharmacol Sci. 2012; 120: 77-88.