Status of sennosides content in various Indian herbal formulations: Method standardization by HPTLC
Abstract
Several polyherbal formulations containing senna (Cassia angustifolia) leaves are available in the Indian market for the treatment of constipation. The purgative effect of senna is due to the presence of two unique hydroxy anthracene glycosides sennosides A and B. A HPTLC method for the quantitative analysis of sennosides A and B present in the formulation has been developed. Methanol extract of the formulations was analyzed on a silica gel 60 GF254 HPTLC plates with spot visualization under UV and scanning at 350 nm in absorption/reflection mode. Calibration curves were found to be linear in the range 200-1,000 ng. The correlation coefficients were found to be 0.991 for sennoside A and 0.997 for sennoside B. The average recovery rate was 95% for sennoside A and 97% for sennoside B showing the reliability and reproducibility of the method. Limit of detection and quantification were determined as 0.05 and 0.25 μg/g respectively. The validity of the method with respect to analysis was confirmed by comparing the UV spectra of the herbal formulations with that of the standard within the same Rf window. The analysis revealed a significant variation in sennosides content.
Introduction
Cassia angustifolia (Family: Caesalpiniaceae), popularly known as senna, is a valuable plant drug in ayurvedic and modern system of medicine for the treatment of constipation (Atal et al., 1982; Das et al., 2003; Martindale, 1977; Sharma, 2004). Sennoside A and B are the two anthraquinone glycosides that are responsible for purgative action of senna. A variety of polyherbal formulations containing senna leaves are available in India to relief constipation and allied troubles. Senna is a strong purgative that should be taken in proper dosage otherwise it may lead to gripping and colon problem (Bhattacharjee, 2004). Different analytical techniques, viz, thin layer chromatography, spectrophotometry, column chromatography have been reported in the literature for estimation of sennosides (Azam et al., 2002; Bala et al., 2000; Habib et al., 1980; Lin et al., 1998). HPTLC method has also been reported (Shah et al., 2000). But these techniques are tedious and time consuming. The present paper reports a simple, rapid and accurate HPTLC method for analysis of sennoside A and B occurring in herbal formulations and to make an assessment on the status of sennoside A and B content in the laxative formulations.
Materials and Methods
Ten different branded herbal formulations (polyherbal, powdered/microgranules) were collected from herbal shops of local markets.
Analytical standards of sennoside A and B were obtained from M/s. ChromaDex, Santa Ana, CA, USA. Solvents (methanol, 2-propanol, ethyl acetate, formic acid) used in entire study were from Merck, India.
Preparation of standard solutions
Standard solutions of sennoside A and sennoside B (1 mg/5 mL) were prepared in methanol.
Extraction of samples
Each 4 g of different branded formulation was sonnicated with 70% methanol (3 x 20 mL) for about 45 min. Then the extract was filtered in a Buchner funnel using Whatman No. 1 filter paper and was concentrated under vacuum in a rotary evaporator at 50ºC, redissolved in methanol and finally reconstituted in 20 mL methanol prior to HPTLC analysis.
Chromatographic parameters
Chromatography was performed on glass-backed silica gel 60 GF254 HPTLC layers (20 x 20 cm; 0.3 mm layer thickness) prepared using a Camag TLC plate auto coater (Camag, Switzerland). Samples and standard compounds 1 and 2 of known concentrations were applied as 8 mm wide bands using Camag Linomat 5 automated TLC applicator (Camag, Multenz, Switzerland) with nitrogen flow providing delivery speed 150 nL/sec from the syringe. These parameters were kept constant through out the analysis.
Detection and quantification of sennosides
After completion of sample application, the plate was developed in a Camag Twin through glass tank pre-saturated with mobile phase of 2-propanol: ethyl acetate: water: formic acid (17:19:12:2.) for one hour. The TLC runs were performed under laboratory conditions of 25 ± 2ºC and 60% relative humidity. After development the plates were taken off and dried by drier. Sennosides A and B were quantified using a Camag TLC Scanner model 3 equipped with Camag Wincats software applying the following conditions: slit width 6 x 0.5 mm, wavelength (λmax) 350 nm, absorption-reflection scan mode. The identification of sennosides A and B in formulations was confirmed by superimposing the UV spectra of samples and standards within the same Rf window.
Validation of HPTLC method
The linearity of the method was evaluated by analyzing a series of standard solutions. Eight different concentrations of standard solutions (each volume repeated twice) containing sennosides A and B were analyzed by HPTLC exactly as described above and the standard calibration curves were obtained by plotting the concentration of standard solutions versus peak area. The amount of sennosides A and B present in the formulations were determined by means of calibration curve. To study the accuracy and precision of the method, recovery studies were performed by addition of standard solutions 0.1, 0.5 and 1 ug per gram of the formulations and the quantitative analysis was repeated thrice. Peak purity test of sennoside A and B were done by comparing UV spectra of sennoside A and B respectively in standard and sample tracks. Peak purity results (obtained by scanning at 350 nm) were satisfactory.
Result and Discussion
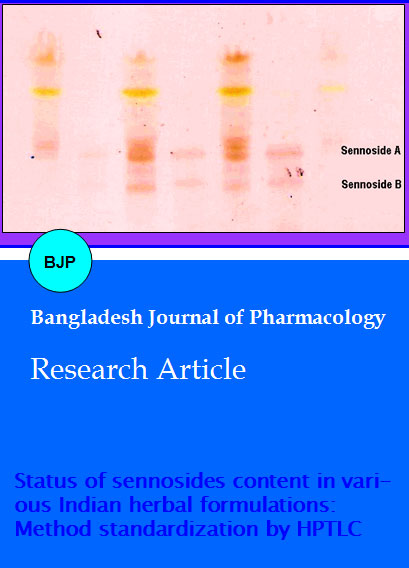
Figure 1 shows the distinct separate bands of sennoside A and B by TLC. The high resolution and reproducible peaks were obtained (Figure 2) by using the mobile phase 2-propanol: ethyl acetate: water: formic acid (17:19:12:2). The wavelength 350 nm was found to give the highest sensitivity. Linearity of sennoside A and B was found in the concentration range 200-1000 ng. Regression analysis of the experimental data points showed a linear relationship with excellent correlation coefficient (r) of sennoside A and sennoside B of 0.991 and 0.997, respectively (Table I).
Figure 1: TLC plate showing the distinct separation of sennoside A and B after development in Twin Trough chamber
Figure 2: Scan (at 350 nm) showing the separation of sennoside A and B in the extract of a laxative formulation
Table I: Rf values by HPTLC and linear regression equation for the determination of sennoside A and B
| Compound | Rf value | Regression equation | r |
|---|---|---|---|
| Sennoside A | 0.84 | Y=7.087X+107.744 | 0.991 |
| Sennoside B | 0.63 | Y=3.589X+702.086 | 0.997 |
The average recovery rate was 95% for sennoside A and 97% for sennoside B (Table II) showing the reliability and reproducibility of the method. In this study the limit of detection (LOD) and limit of quantification of sennoside A and B were determined to be 0.05 and 0.25 mg/g.
Table II: Precision and recovery result in spike test of Sennoside A and Sennoside B
| Compound | Amount fortified (mg/g) |
Observed value (mg/g) |
Observed value (mg/g) |
Observed value (mg/g) |
C.V. (mg/g) |
Average recovery (%) |
|---|---|---|---|---|---|---|
| Sennoside A | 0.1 | 0.097 | 0.089 | 0.098 | 5.1 | 95 |
| Sennoside A | 0.5 | 0.451 | 0.484 | 0.493 | 4.65 | 95 |
| Sennoside A | 1 | 0.981 | 0.933 | 0.942 | 2.68 | 95 |
| Sennoside B | 0.1 | 0.098 | 0.102 | 0.105 | 3.45 | 97 |
| Sennoside B | 0.5 | 0.482 | 0.462 | 0.501 | 4.04 | 97 |
| Sennoside B | 1 | 0.954 | 0.991 | 1.01 | 3.01 | 97 |
The result (Table III) showed that the relative amount of sennoside A and B in formulation-1 was highest and in formulation-10 it was lowest. The result reflected a 2.8 times higher concentration in formulation-1 compared to that of formulation-10. The minimum content of sennoside B (considering the highest content as 100%) was shown only by 5.4% in case of formulation-10 and less than 17.5% in case of formulation number '3' to '9'. This result clearly revealed that there is a significant variation of sennoside A and B content in popular herbal formulations. Since the chemical contents are biologically active, variation in their daily dose may impact on health benefits. Therefore, it is necessary that herbal formulations should always be analyzed to maintain the quality of the herbs present inthe formulation.
Table III: Sennoside A and B in selected herbal formulations
| Herbal formulations | Sennoside A (mg/g of formulation) |
Sennoside B (mg/g of formulation) |
|---|---|---|
| Formulation-1 | 2.5 | 25.9 |
| Formulation-2 | 2.3 | 12.7 |
| Formulation-3 | 2.1 | 2.6 |
| Formulation-4 | 1.8 | 1.9 |
| Formulation-5 | 1.6 | 1.9 |
| Formulation-6 | 1.6 | 1.7 |
| Formulation-7 | 1.4 | 4.5 |
| Formulation-8 | 1.2 | 1.5 |
| Formulation-9 | 0.9 | 1.5 |
| Formulation-10 | 0.9 | 1.4 |
Conclusion
The proposed HPTLC method can be used for the determination of sennoside A and B in various commercial formulations for quality evaluation. Method is very simple, rapid and suitable for rapid screening of plant materials for genotypic assessment and can be performed without any special sample pretreatment. The method is less expensive than an LC method. The method is, thus, suitable for quality control laboratories, where economical use of time and space is essential.
Ethical Issue
The study was approved by the Ethical Committee of the Bidhan Chandra Krishi Viswavidyalaya
References
Atal CK, Kapoor BM. Cultivation and utilization of medicinal plants. Jammu Twai, India, RRL, 1982, p 8.
Azam MM, Limy T. An improved HPLC method for estimation of sennosides in senna. Indian J Pharm Sci. 2002; 64: 178-81.
Bala S, Uniyal GC, Dubey T, Singh SP. An improved method for the analysis of sennosides in Cassia angustifolia by HPLC presented on national seminars on frontiers of research and development in medicinal plants. Lucknow, CIMAP, 2000.
Bhattacharjee SK. A handbook of medicinal plant. Jaipur, India, Pointer Publisher, 2004, pp 74-79.
Das PN, Purohit SS, Sharma AK, Kumar T. A handbook of medicinal plants. Jodhpur, India, Agrobios, 2003, p 118.
Evans FJ, Lee MG, Games DE. Electron impact, chemical ionization and field desorption mass spectra of some anthraquinone and anthrone derivatives of plant origin. Biol Mass Spectrometry. 1979; 6: 374-80.
Habib AA, EI-Sebakhy NA. Spectrophotometric estimation of sennosides and rhein glycosides in senna and its preparations. J Nat Prod. 1980; 43: 452-58.
Khafagy SM, Girgis AN, Khayyal SE, Helmi MA. Estimation of sennosides A, B, C and D in senna leaves, pods and formulation. Planta Med. 1972; 21: 304-09.
Lin YT, Huang CY. Determination of sennoside A and B in diet tea by HPLC. J Fd Drug Anal. 1998; 6: 433-38.
Martindale. The extra pharmacopoeia. 27th ed. London, The Pharmaceutical Press, 1977, pp 1342-43.
Shah SA, Ravisankara MN, Nirmal A, Shishoo CJ, Rathod IS, Suhagia BN. Estimation of individual sennosides in plant material and marketed formulations by an HPTLC method. J Pharm Pharmocol. 2000; 52: 445-49.
Sharma R. Agrotechniques of medicinal plants. Delhi, Daya Publishing House, 2004, pp 176-77.
Evans FJ, Lee MG, Games DE. Electron impact, chemical ionization and field desorption mass spectra of some anthraquinone and anthrone derivatives of plant origin. Biol Mass Spectrometry. 1979; 6: 374-80.
Habib AA, EI-Sebakhy NA. Spectrophotometric estimation of sennosides and rhein glycosides in senna and its preparations. J Nat Prod. 1980; 43: 452-58.
Khafagy SM, Girgis AN, Khayyal SE, Helmi MA. Estimation of sennosides A, B, C and D in senna leaves, pods and formulation. Planta Med. 1972; 21: 304-09.
Lin YT, Huang CY. Determination of sennoside A and B in Diet tea by HPLC. J Fd Drug Anal. 1998; 6: 433-38.
Martindale. The extra pharmacopoeia. 27th ed. London, The Pharmaceutical Press, 1977, pp 1342-43.
Shah SA, Ravisankara MN, Nirmal A, Shishoo CJ, Rathod IS, Suhagia BN. Estimation of individual sennosides in plant material and marketed formulations by an HPTLC method. J Pharm Pharmocol. 2000; 52: 445-49.
Sharma R. Agrotechniques of medicinal plants. Delhi, Daya Publishing House, 2004, pp 176-77.