Effects of coenzyme Q10 supplementation on the anthropometric variables, lipid profiles and liver enzymes in patients with non-alcoholic fatty liver disease
Abstract
This randomized double-blind placebo-controlled trial was conducted on 41 patients with non-alcoholic fatty liver disease. Patients in intervention group received 100 mg/day coenzyme Q10 (CoQ10) for four weeks. There was a significant reduction in waist circumference and aspartate aminotransferase concentrations after CoQ10 supplementation (p<0.05). Dietary fiber was in negative correlation with change in serum alanine aminotransferase (ALT) concentrations (r = -410, p = 0.04), and dietary fat intake was in positive relation with serum triglyceride (r = 463, p = 0.04) and in negative relation with serum high-density lipoprotein cholesterol (HDL-C) (r = -533, p = 0.02) in CoQ10-treated group. CoQ10 supplement is able to reduce central obesity and improve liver function in non-alcoholic fatty liver disease. Dietary factors were also significant determinants of change in liver-specific enzyme ALT and lipid profile in these patients. Further trials with higher dose of CoQ10 and longer treatment periods are warranted to better clarify these findings.
Introduction
Non-alcoholic fatty liver disease is defined as the accumulation of fat mainly triglyceride in hepatic cells exceeding 5-10% of liver weight (Chalasani et al., 2012). The prevalence in the general population and in obese individuals is 20-30% and 67-75% respectively (Browning et al., 2004). Currently, it is the third cause of liver transplant and is associated with obesity, metabolic syndrome, insulin resistance, type 2 diabetes mellitus and dyslipidemia (Chalasani et al., 2012; Farhangi et al., 2013; Jahangiry et al., 2014).
The oxidative stress is implicated as a key factor contributing to liver damage in patients suffering from non-alcoholic fatty liver disease (Madan et al., 2006). There is currently no effective treatment. The main treatments are based on the management of insulin resistance and oxidative stress. Numerous evidences suggest that antioxidants such as vitamin E, vitamin C, α-tocopherol and betaine are capable in improving clinical and histological features of non-alcoholic fatty liver disease (Mouzaki and Allard, 2012)‌.
Coenzyme Q10 (CoQ10) is an essential component of the mitochondrial respiratory chain and a potent lipophilic antioxidant present in almost all human tissues (Mabuchi et al., 2007). CoQ10 protects against oxidative stress produced by active forms of the antioxidants ascorbic acid and tocopherol (Marcoff and Thompson, 2007). It has been reported that CoQ10 depletion in plasma as a marker of mitochondrial dysfunction is occurred in non-alcoholic fatty liver disease (Yesilova et al., 2005; Wei et al., 2008). CoQ10 therapy improves the clinical and histologic features through inhibition of free fatty acids oxidation, lipid peroxidation, formation of free radicals. This finally leads to reduction of hepatic fat accumulation (Hashemi et al., 2008) and improved mitochondrial dysfunction (Miles, 2007)‌.
In a report by Sohet ‌CoQ10 supplementation reduced the oxidative stress and inflammation in the liver tissue of mice (Sohet et al., 2009). In another study, administration of 200 mg/kg CoQ10 in cirrhotic rats improved liver enzyme activities compared with control group (Ali et al., 2010). Other animal studies have also confirmed these findings (Sumimoto et al., 1987; Amimoto et al., 1995; Jimenez-Santo et al., 2014).
In our review of literature, we found only one study evaluated the effects of oral CoQ10 on metabolic and anthropometric variables without reporting its effect on liver enzymes (Mohammadshahi M et al., 2014)‌; Therefore, in the current study we aimed to investigate the effects of CoQ10 on liver function, anthropometric parameters and metabolic profile including lipid profiles, aspartate aminotransferase (AST) and alanine aminotransferase (ALT) in patients with non-alcoholic fatty liver disease.
Materials and Methods
In this randomized double-blind placebo-controlled clinical trial, a total of 126 patients with non-alcoholic fatty liver disease were first assessed for eligibility and 44 patients meet the inclusion criteria. The patients were selected from those referring to Tabriz University of Medical Sciences clinics.
The physician diagnosed the disease based on the findings of liver ultrasonography. The inclusion criteria were aged between 20-50 years for women and 20-65 years for men. Exclusion criteria were as follows: Any history of chronic liver disease, gastrointestinal disease, diabetes, rheumatoid arthritis, heart failure, renal disease, taking antioxidants and omega-3 supplements for at least 3 months prior participation in the study.
The patients were randomly allocated into two groups of intervention and control. Subjects in the intervention group received an oral dose of CoQ10 capsules as softgels containing 100 mg CoQ10 (Nature's Plus, NY, USA) and control groups received placebo daily for 4 weeks. Placebo capsules were same in color and shape with supplements. The subjects were advised to take the supplements within meals. Compliance with CoQ10 use monitored through phone interviews. The safety of the dose and duration of the study had been proved by previous reports (Ikematsu et al., 2006; Hathcock and Shao, 2006).
Weight was measured with minimal clothing without shoes with a calibrate scale (SECA, Germany) to the nearest 0.5 kg and height sing a measuring tape to the nearest 0.1 cm. Body mass index was calculated as weight (kg) divided by height squared (m2). Waist circumference (Kędziora-Kornatowska et al, (2010) was measured as waist mid-way between the lowest rib and the iliac crest, and hips at the greater trochanters (Consultation, 2011). All of the anthropometric measurements were analyzed at the beginning and at the end of the study.
All the subjects were instructed by a dietitian to maintain 3-day dietary record, including two week days and one weekend day using standard household measurements before and after the end of the study period. Dietary energy and nutrient intake were analyzed by Nutritionist IV software (First Data Bank, Inc., USA). Physical activity was assessed by international physical activity questionnaire (IPAQ) and subjects were classified into three levels of mild, moderate and sever categorizes of physical activity according to the protocol (IPAQ, 2005).‌
Venous blood samples were collected after 12 hours of overnight fasting, in the beginning and end of the study. Serum total cholesterol (TC), TG, high-density lipoprotein cholesterol (HDL-C), ALT and AST concentrations were assayed using commercial kits (Pars Azmoon Inc, Iran) by enzymatic methods. Low-density lipoprotein cholesterol (LDL-C) was calculated by Friedewald Formula (Friedewald et al., 1972). All of the biochemical assessments were performed by a trained assessor who was blind to the group assignment.
All data were analyzed using the SPSS software (Statistical Package for the Social Sciences, version 21.0, SPSS Inc, USA). All data were expressed as means ± standard deviation or numbers and percentages. Kolmogorov-Smirnov test was used to assess normal distribution of variables. Before-after comparison of anthropometric and biochemical variables were performed by paired t-test. Serum concentrations of ALT were log transformed because of skewed distributions. Categorical variables were compared using the chi-squared test. Comparison of continuous variables adjusted for the confounders were performed by analysis of covariance (ANCOVA). Partial Correlation analysis was used to evaluate the correlation between changes in liver enzymes, lipid profiles and dietary factors adjusted for the confounding effects of age and gender. p values less than 0.05 were considered to be significant.
Results
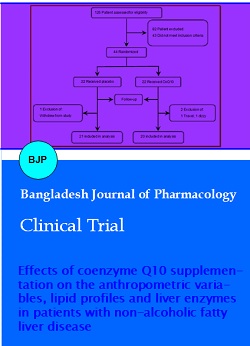
During the four week treatment period there were three withdrawals from the study. Two persons in intervention group (1, travel; 1, dizzy) and 1 person in the control group (decline to continue) withdrew from study (Figure 1). No serious adverse effect was reported in the current study.
Figure 1: Flowchart of patient selection
Demographic characteristics of the study participants are shown in Table I. Age, marital status, educational attainment, physical activity level and other demographic characteristics were similar between groups. The comparison of mean energy and nutrients intake in treatment groups is presented in Table II. Dietary intakes of energy, macronutrients were not statistically significant between two groups (Table II).
Table I: Demographic characteristics of participants
| Variable | Intervention (n = 20) | Placebo (n = 21) | p value |
|---|---|---|---|
| Age (years) | 42.7 ± 10.2 | 42.2 ± 10.8 | 0.86 |
| Gender [n (%)] | |||
| Male | 15 (75) | 16 (76.2) | 0.5 |
| Female | 5 (25) | 5 (23.8) | |
| Marital status [n (%)] | |||
| Married | 18 (90) | 20 (95.2) | 0.52 |
| Unmarried | 2 (10) | 1 (4.8) | |
| Smoking [n (%)] | 1 (5) | 1 (4.8) | 0.97 |
| Education (years) | |||
| 12> | 3 (15) | 2 (9.5) | 0.47 |
| ≥12 | 17 (85) | 19 (90.5) | |
| Physical activity level | |||
| Mild | 9 (45) | 8 (38.1) | 0.8 |
| Moderate | 9 (45) | 12 (57.1) | |
| Severe | 2 (10) | 1 (4.8) | |
| Grading of NAFLD | |||
| Grade 1 (mild) | 11 (55) | 15 (71.4) | 0.32 |
| Grade 2 (moderate) | 8 (40) | 4 (19) | |
| Grade 3 (severe) | 1 (5) | 2 (9.5) | |
| Data are presented as mean ± SD or number (percent); NAFLD, non-alcoholic fatty liver disease; p value from chi-squared test | |||
Table II: Dietary intake in intervention and control groups at baseline and end of the study
| Variable | Intervention (n=20) | Placebo (n=21) | P valueb |
|---|---|---|---|
| Energy (Kcal) | |||
| Before | 1959.2 ± 488.2 | 2127.7 ± 365.4 | 0.21 |
| After | 2098.4 ± 715.3 | 2155.4 ± 405.1 | 0.16 |
| p valuea | 0.1 | 0.46 | |
| Carbohydrate (g) | |||
| Before | 313.1 ± 91.4 | 344.6 ± 86.6 | 0.26 |
| After | 349.0 ± 150.1 | 344.8 ± 82.7 | 0.35 |
| p valuea | 0.25 | 0.97 | |
| Protein (g) | |||
| Before | 77.1 ± 14.4 | 76.6 ± 15.4 | 0.91 |
| After | 80.6 ± 24.3 | 81.8 ± 18.3 | 0.53 |
| p valuea | 0.09 | 0.11 | |
| Fat (g) | |||
| Before | 48.5 ± 14.4 | 51.3 ± 16.9 | 0.57 |
| After | 53.5 ± 17.1 | 51.7 ± 17.6 | 0.5 |
| p valuea | 0.12 | 0.92 | |
| Vitamin E | |||
| Before | 3.8 ± 2.6 | 3.1 ± 1.4 | 0.35 |
| After | 4.4 ± 4.6 | 2.8 ± 1.4 | 0.19 |
| p valuea | 0.63 | 0.06 | |
| Vitamin C | |||
| Before | 139.1 ± 64.1 | 93.7 ± 43.9 | 0.22 |
| After | 135.8 ± 64.7 | 83.8 ± 34.8 | 0.17 |
| p valuea | 0.95 | 0.3 | |
| Fiber (g) | |||
| Before | 15.1 ± 4.6 | 14.9 ± 6.1 | 0.93 |
| After | 15.1 ± 4.9 | 14.6 ± 5.3 | 0.79 |
| p valuea | 0.98 | 0.73 | |
| Data are presented as mean ± SD; ap value from paired t-test; bp value from ANCOVA test | |||
Baseline concentrations of biochemical parameters between two groups were not statistically significant (Table III). Serum AST concentrations significantly decreased in CoQ10 group (p = 0.05). There was also a significant reduction in WC in CoQ10 treated group (p = 0.03). No significant change in serum lipid was observed.
Table III: Anthropometric and biochemical variables in the CoQ10- and placebo-treated participants
| Variable | Intervention (n = 20) | Placebo (n = 21) | p valuea |
|---|---|---|---|
| BMI (kg/m2) | |||
| Before | 30.5 ± 3.9 | 28.7 ± 4.02 | 0.15 |
| After | 30.3 ± 3.8 | 28.2 ± 3.6 | 0.08 |
| p valueb | 0.12 | 0.3 | |
| WC (cm) | |||
| Before | 105.2 ± 6.6 | 98.7 ± 7.6 | <0.01 |
| After | 103.9 ± 7.01 | 98.7 ± 7.3 | 0.02 |
| p valueb | 0.03 | 0.91 | |
| HDL-C (mg/dL) | |||
| Before | 45.4 ± 8.1 | 47.7 ± 10.08 | 0.43 |
| After | 46.9 ± 9.1 | 49.4 ± 13.5 | 0.75 |
| p valueb | 0.52 | 0.45 | |
| LDL-C (mg/dL) | |||
| Before | 100.4 ± 27.1 | 109.6 ± 29.9 | 0.6 |
| After | 103.7 ± 30.8 | 111.7 ± 31.5 | 0.51 |
| p valueb | 0.56 | 0.7 | |
| AST (mg/mL) | |||
| Before | 32.6 ± 12.7 | 32.5 ± 14.2 | 0.98 |
| After | 28.2 ± 9.8 | 29.8 ± 12.5 | 0.55 |
| p valueb | 0.04 | 0.26 | |
| ALT (mg/mL) | |||
| Before | 36.1 ± 23.4 | 26.6 ± 11.5 | 0.19 |
| After | 31.8 ± 22.07 | 22.9 ± 9.2 | 0.13 |
| p valueb | 0.18 | 0.1 | |
| Data are presented as mean ± SD; BMI, body mass index; WC, waist circumference; TG, triglyceride; TC, total cholesterol; HDLC, high-density lipoprotein cholesterol; LDL-C, low-density lipoprotein cholesterol; AST, aspartate aminotransferase; ALT, alanine aminotransferase; ap value from paired t-test; bp value from ANOCOVA test | |||
In partial correlation analysis adjusted for the confounding effects of age and sex dietary factors were significant predictors of change in liver enzymes and lipid profile in CoQ10-treated group; as shown in Table IV dietary fiber was in negative correlation with change in serum ALT concentrations (r = -410, p = 0.04). Additionally dietary fat intake was in positive relation with serum TG (r = 463, p = 0.04) and in negative relation with serum HDL-C (r = -533, p = 0.02).
Table IV: Correlation between changes in liver enzymes, lipid profiles and dietary intakes of energy and fiber in CoQ10-treated group
| Variable | AST (mg/mL) | ALT (mg/mL) | TC (mg/mL) | LDL-C (mg/mL) | HDL-C (mg/mL) | TG (mg/mL) |
|---|---|---|---|---|---|---|
| Energy (kcal) | 0.119 | 0.073 | 0.072 | -0.24 | 0.25 | 0.36 |
| Carbohydrate (g) | 0.071 | 0.037 | 0.079 | -0.201 | 0.328 | 0.264 |
| Protein (g) | 0.058 | 0.124 | 0.082 | 0.051 | 0.358 | -0.013 |
| Fat (g) | 0.194 | -0.066 | -0.02 | -0.141 | -0.533a | 0.463a |
| Dietary fiber (g) | -0.287 | -0.410a | 0.269 | 0.272 | 0.184 | 0.02 |
| TG, triglyceride; TC, total cholesterol; HDL-C, high-density lipoprotein cholesterol; LDL-C, low-density lipoprotein cholesterol; AST, aspartate aminotransferase; ALT, alanine aminotransferase; ap<0.05 from partial correlation coefficient (adjusted for age and sex) | ||||||
Discussion
In the present investigation, we observed significant decrease in waist circumference as a marker of central obesity and significant reduction in serum AST concentrations in CoQ10 supplemented group. Moreover, dietary fiber was in negative correlation with change in serum ALT concentrations; also dietary fat was in positive relation with serum TG and in negative relation with serum HDL-C.
Similar to our findings in a study, oral administration of CoQ10 led to significant weight loss in mouse (Ferrante et al., 2002). Other study indicated CoQ10 prevented increase in body weight and adiposity by increasing lipid oxidation in adipose tissue and reducing lipid synthesis (Carmona et al., 2009)‌.
The primary function of CoQ10 in cells is in generating energy; being at the core of cellular energy processes CoQ10 has potential for reduce weight by improving cellular bioenergetics (Alam and Rahman, 2014)‌; Inhibition of CoQ10 synthesis strongly triggered adipocyte differentiation while increment of CoQ10 acts in inverse direction (Bour et al., 2011). CoQ10 treatment increases fat oxidation and energy consumption in adipose tissue. Decreased mRNA expression of the lipogenic enzymes (Carmona et al., 2009) inhibition of the mitochondrial electron transport chain activity (Choo et al., 2006) and CoQ10 mediated activation of peroxisome proliferator activated receptor (PPAR)‌ (Lee et al., 2012; Madrazo and Kelly, 2008) are other possible suggested underlying mechanisms.
In this study, treatment with CoQ10 has no significant effect on lipid profiles. This findings is consistent with a study reporting no significant reduction in lipid profiles after 12 weeks supplementation with 100 mg/day CoQ10 in patient with non-alcoholic fatty liver disease (Mohammadshahi et al., 2014). Other study has also reported no significant change in serum lipids except a rise in HDL-C concentrations (Mabuchi et al., 2007).‌ These inconsistencies might be attributed to difference in dose and duration of supplementation period.
In the current study we observed significant decrease in serum AST concentrations in CoQ10 treated group; in a study, administration of 200 mg/kg CoQ10 as a single dose in cirrhotic rats, reduced serum ALT and AST activities (p<0.05) (Ali et al., 2010). Other studies also reported same results in experimental models (Jimenez-Santo et al., 2014; Othman et al., 2008). CoQ10 may have therapeutic effects against metabolic-stress-induced liver damage possibly through its antioxidant, anti-inflammatory and antiapoptotic actions (Fouad and Jresat, 2012; Esfahani et al., 2013)
Dietary intakes of energy, macronutrients and antioxidants at baseline and after intervention were not different in our participants; however in partial correlation analysis adjusting for the confounders, dietary fiber and fat intake were in significant relation with serum ALT and serum lipids. Numerous evidences also suggest that high intake of fiber tend to be favorable in improving metabolic abnormalities of non-alcoholic fatty liver disease (Kani et al., 2014). In a study, high intake of complex carbohydrates especially whole grains due to high content of dietary fibers was associated with lowering the non-alcoholic fatty liver disease progression (Ross et al., 2013). In other study, low dietary consumption of fiber positively associated with the pathogenesis of non-alcoholic fatty liver disease (Papandreou et al., 2012). Lower fiber consumption may also be associated with higher BMI, higher levels of serum lipids and lipid accumulation (Thomas et al., 2013).
Conclusion
CoQ10 supplementation at a dosage of 100 mg/day significantly improved several anthropometric and metabolic parameters. Moreover, dietary factors were significant predictors of changes in metabolic features of non-alcoholic fatty liver disease.
Ethical Issue
Patients were informed about the purpose and procedures of this trial (Farhangi et al., 2014). Written informed consent was obtained from participants before participating in the study. The protocol of research was approved by the ethics committee of Tabriz University of Medical Sciences and Health Services (registration number: 9237).
Acknowledgements
We thank all of the participants in this study. Hereby we confirm that each coauthor participated in the work sufficiently and the authorship. We thank research under-secretary of Tabriz University of Medical Sciences for financial support.
References
Alam MA, Rahman MM. Mitochondrial dysfunction in obesity: Potential benefit and mechanism of Co-enzyme Q10 supplementation in metabolic syndrome. J Diabetes Metab Disord. 2014; 13: 1-13.
Ali SA, Faddah L, Abdel-Baky A , Bayoumi A. Protective effect of l-carnitine and coenzyme Q10 on CCL4-induced liver injury in rats. Sci Pharm. 2010; 78: 881-96.
Amimoto T, Matsura T, Koyama S, Nakanishi T, Yamada K , Kajiyama G. Acetaminophen-induced hepatic injury in mice: The role of lipid peroxidation and effects of pretreatment with coenzyme Q10 and alpha-tocopherol. Free Radic Biol Med. 1995; 19: 169-76.
Bour S, Carmona MC, Galinier A, Caspar-Bauguil S, Van Gaal L, Staels B, Pénicaud L , Casteilla L. Coenzyme Q as an antiadipogenic factor. Antioxid Redox Signal. 2011; 14: 403-13.
Browning JD, Szczepaniak LS, Dobbins R, Horton JD, Cohen JC, Grundy SM , Hobbs HH. Prevalence of hepatic steatosis in an urban population in the United States: Impact of ethnicity. Hepatology 2004; 40: 1387-95.
Carmona MC, Lefebvre P, Lefebvre B, Galinier A, Bénani A, Jeanson Y, Louche K, Flajollet S, Ktorza A , Dacquet C. Coadministration of coenzyme Q prevents rosiglitazone-induced adipogenesis in ob/ob mice. Int J Obes. 2009; 33: 204-11.
Chalasani N, Younossi Z, Lavine JE, Diehl AM, Brunt EM, Cusi K, Charlton M , AJS. The diagnosis and management of non-alcoholic fatty liver disease: Practice guideline by the American Association for the Study of Liver Diseases, American College of Gastroenterology, and the American Gastroenterological Association. Hepatology 2012; 55: 2005-23.
Choo H, Kim J, Kwon O, Lee C, Mun J, Han S, Yoon Y, Yoon G, Choi K, Ko Y. Mitochondria are impaired in the adipocytes of type 2 diabetic mice. Diabetologia 2006; 49: 784-91.
Consultation WE. Waist circumference and waisthip ratio. 2011.
Esfahani SA, Esmaeilzadeh E, Bagheri F, Emami Y, Farjam M. The effect of co-enzyme Q10 on acute liver damage in rats: A biochemical and pathological study. Hepat Mon. 2013; 13: e13685.
Farhangi MA, Keshavarz SA, Eshraghian M, Ostadrahimi A, Saboor-Yaraghi AA. Vitamin A supplementation, serum lipids, liver enzymes and C-reactive protein concentrations in obese women of reproductive age. Ann Clin Biochem. 2013; 50: 25-30.
Farhangi MA, Alipour B, Jafarvand E, Khoshbaten M. Oral coenzyme Q10 supplementation in patients with non-alcoholic fatty liver disease: Effects on serum vaspin, chemerin, pentraxin 3, insulin resistance and oxidative stress. Arch Med Res. 2014; 45: 589-95.
Ferrante RJ, Andreassen OA, Dedeoglu A, Ferrante KL, Jenkins BG, Hersch SM, Beal MF. Therapeutic effects of coenzyme Q10 and remacemide in transgenic mouse models of Huntington's disease. J Neurosci. 2002; 22: 1592-99.
Fouad AA, Jresat I. Hepatoprotective effect of coenzyme Q10 in rats with acetaminophen toxicity. Environ Toxicol Pharmacol. 2012; 33: 158-67.
Friedewald WT, Levy RI, Fredrickson DS. Estimation of the concentration of low-density lipoprotein cholesterol in plasma, without use of the preparative ultracentrifuge. Clin Chem. 1972; 18: 499-502.
Hashemi M, Bahari A, Bahari G, Ghavami S. Coenzyme Q10 may be effective in the treatment of non alcoholic fatty liver disease (NAFLD). Irn J Med Hypotheses Ideas. 2008; 2: 1-4.
Hathcock JN, Shao A. Risk assessment for coenzyme Q10 (Ubiquinone). Regul Toxicol Pharmacol. 2006; 45: 282-88.
Ikematsu H, Nakamura K, Harashima S, Fujii K, Fukutomi N. Safety assessment of coenzyme Q10 (Kaneka Q10) in healthy subjects: A double-blind, randomized, placebo-controlled trial. Regul Toxicol Pharmacol. 2006; 44: 212-18.
International physical activity questionnaire (IPAQ) guidelines for data processing and analysis of the international physical activity questionnaire. November 2005. Available from: http://www.ipaq.ki.se/scoring.pdf.
Jahangiry L, Shojaeizadeh D, Montazeri A, Najafi M, Mohammad K, Abbasalizad Farhangi M. Modifiable lifestyle risk factors and metabolic syndrome: opportunities for a web-based preventive program. J Res Health Sci. 2014; 14: 303-07.
Jimenez-Santo MA, Juarez-Rojop IE, Tovilla-Zarate CA, Espinosa-Garcia MT, Juarez-Oropeza MA, Ramon-Frias T, Bermudez-Ocana DY, DÃaz-Zagoya JC. Coenzyme Q10 supplementation improves metabolic parameters, liver function and mitochondrial respiration in rats with high doses of atorvastatin and a cholesterol-rich diet. Lipids Health Dis. 2014; 13: 1-10.
Kani AH, Alavian SM, Haghighatdoost F, Azadbakht L. Diet macronutrients composition in non-alcoholic fatty liver disease: A review on the related documents. Hepat Mon. 2014; 14: 1-9.
Kędziora-Kornatowska K, Czuczejko J, Motyl J, Szewczyk-Golec K, Kozakiewicz M, Pawluk H, Kędziora J, Błaszczak R, Banach M , Rysz J. Effects of coenzyme Q10 supplementation on activities of selected antioxidative enzymes and lipid peroxidation in hypertensive patients treated with indapamide: A pilot study. Arch Med Sci. 2010; 6: 513-18.
Lee SK, Lee JO, Kim JH, Kim N, You GY, Moon JW, Sha J, Kim SJ, Lee YW , Kang HJ. Coenzyme Q10 increases the fatty acid oxidation through AMPK-mediated PPARα induction in 3T3-L1 preadipocytes. Cell Signal. 2012; 24: 2329-36.
Mabuchi H, Nohara A, Kobayashi J, Kawashiri MA, Katsuda S, Inazu A, Koizumi J. Effects of CoQ10 supplementation on plasma lipoprotein lipid, CoQ10 and liver and muscle enzyme levels in hypercholesterolemic patients treated with atorvastatin: A randomized double-blind study. Atherosclerosis 2007; 195: 182-89.
Madan K, Bhardwaj P, Thareja S, Gupta SD, Saraya A. Oxidant stress and antioxidant status among patients with non-alcoholic fatty liver disease (NAFLD). J Clin Gastroenterol. 2006; 40: 930-35.
Madrazo JA, Kelly DP. The PPAR trio: Regulators of myocardial energy metabolism in health and disease. J Mol Cell Cardiol. 2008; 44: 968-75.
Marcoff L, Thompson PD. The role of coenzyme Q10 in statin-associated myopathy: A systematic review. J Am Coll Cardiol. 2007; 49: 2231-37.
Miles MV. The uptake and distribution of coenzyme Q10. Mitochondrion 2007; 7: 72-77.
Mohammadshahi M, Farsi F, Nejad PA, Hajiani E, Zarei M, Engali KA. The coenzyme Q10 supplementation effects on lipid profile, fasting blood sugar, blood pressure and oxidative stress status among non-alcoholic fatty liver disease patients: A randomized, placebo-controlled, pilot study. J Gastroenterol Hepatol Res. 2014; 3: 1108-13.
Mouzaki M, Allard J. Non-alcoholic steatohepatitis: The therapeutic challenge of a global epidemic. Ann Gastroenterol. 2012; 25: 207-17.
Othman AA, Shoheib ZS, Abdel-Aleem GA, Shareef MM. Experimental schistosomal hepatitis: Protective effect of coenzyme-Q10 against the state of oxidative stress. Exp Parasitol. 2008; 120: 147-55.
Papandreou D, Karabouta Z, Pantoleon A, Rousso I. Investigation of anthropometric, biochemical and dietary parameters of obese children with and without non-alcoholic fatty liver disease. Appetite 2012; 59: 939-44.
Ross AB, Godin JP, Minehira K, Kirwan JP. Increasing whole grain intake as part of prevention and treatment of non-alcoholic fatty liver disease. Int J Endocrinol. 2013; 2013: 1-13.
Sohet FM, Neyrinck AM, Pachikian BD, de Backer FC, Bindels LB, Niklowitz P, Menke T, Cani PD, Delzenne NM. Coenzyme Q10 supplementation lowers hepatic oxidative stress and inflammation associated with diet-induced obesity in mice. Biochem Pharmacol. 2009; 78: 1391-400.
Sumimoto K, Inagaki K, Ito H, Marubayashi S, Yamada K, Kawasaki T, Dohi K. Ischemic damage prevention by co-enzyme Q10 treatment of the donor before orthotopic liver transplantation: Biochemical and histologic findings. Surgery 1987; 102: 821-27.
Thomas AP, Dunn TN, Drayton JB, Oort PJ, Adams SH. A dairy-based high calcium diet improves glucose homeostasis and reduces steatosis in the context of preexisting obesity. Obesity 2013; 21: E229-35.
Wei Y, Rector RS, Thyfault JP, Ibdah JA. Non-alcoholic fatty liver disease and mitochondrial dysfunction. World J Gastroenterol. 2008; 14: 193-99.
Yesilova Z, Yaman H, Oktenli C, Ozcan A, Uygun A, Cakir E, Sanisoglu SY, Erdil A, Ates Y, Aslan M. Systemic markers of lipid peroxidation and antioxidants in patients with nonalcoholic fatty liver disease. Am J Gastroenterol. 2005; 100: 850-55.