Figure
Figure
| Primary outcome data should not be presented in figures alone. It should be written in the text, table, and abstract. Restrict the number of Figures needed to explain and support the argument of the manuscript. Do not duplicate data in Table and Figure. Figures like bar graphs, line graphs, flow diagrams, survival plots, box-and-whisker plots, forest plots, dot plots, scatter plots, and photographs are accepted during the manuscript submission. Pie charts and 3-D graphs should not be used and should be revised to alternative graph types. |
| ☲ Do not put a box around the figure. We shall add while publish
In the manuscript ☱ The number of all figures (e.g. Figure 1, Figure 2) in the order of their citation in the text. ☲ The number of figures should be limited. It is strictly maintained in the “Letter to the Editor†section. ☳ Avoid complex composite or multipart figures unless justified. ☰ All Figures are placed at the end of the manuscript. Each Figure with a legend is written in brief preferably no longer than 10 to 15 words.☱ Each Figure file (e.g., Figure 1, Figure 2) should be uploaded separately. Figure legend is written in the last part of the manuscript. ☲ For footnotes, use letters (a, b, c, etc), not symbols. ☳ All symbols and abbreviations should be defined in a legend. ☰ Acceptable file Format for initial submission: .doc, .docx |
Bar graph (an example)
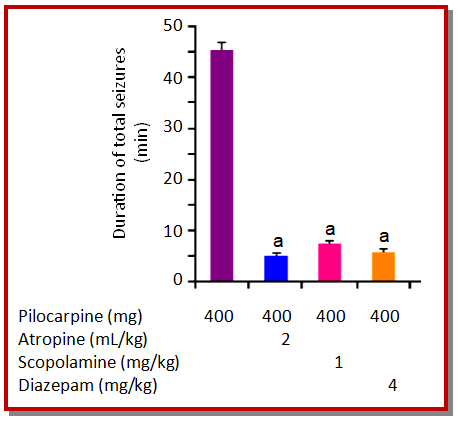
| ☲ Bar graphs are usually vertical. But when categories have long titles, they may run horizontally.
☲ All bars should be black. We shall modify it while publishing. ☲ Do not give any extra background horizontal lines within the graph. ☲ The scale on the horizontal axis (x) and vertical axis (y) axis should begin at 0, and the axis should not be broken. ☲ Font family: Arial or Calibri; Font size: 7 point ☲ Statistical significance must be written in letters (a, b, c, etc), not symbols [“*†(single star) or “**†double star] |
Line graph (an example)
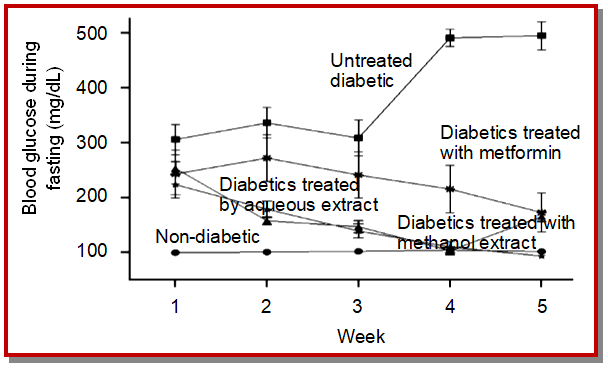
| ☲ The line graph is used to demonstrate the relationship between 2 or more quantitative variables, such as changes over time.
☲ The dependent variable appears on the vertical axis (y) and the independent variable on the horizontal axis (x); the axes should be continuous, not broken. ☲ Do not give any extra background horizontal lines within the graph ☲ If possible, label each line with short text for understanding the purpose ☲ Font family: Arial or Calibri; Font size: 7 point |
Flow diagram (an example)
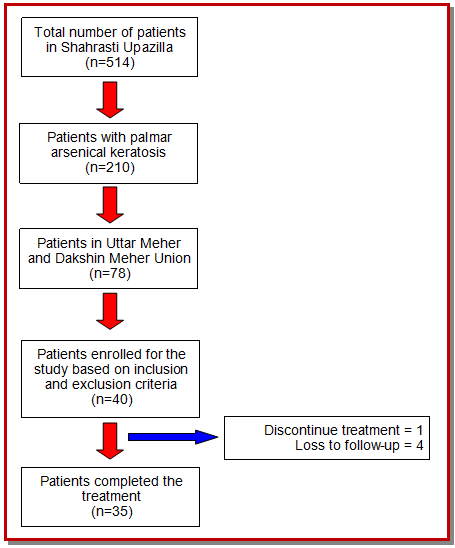
The flow diagram is used to show participant recruitment and follow-up or inclusions and exclusions usually in a Clinical Trial and meta-analysis. There is software that can help you to draw flow diagrams (e.g., https://app.creately.com/)
Forest plot (an example)
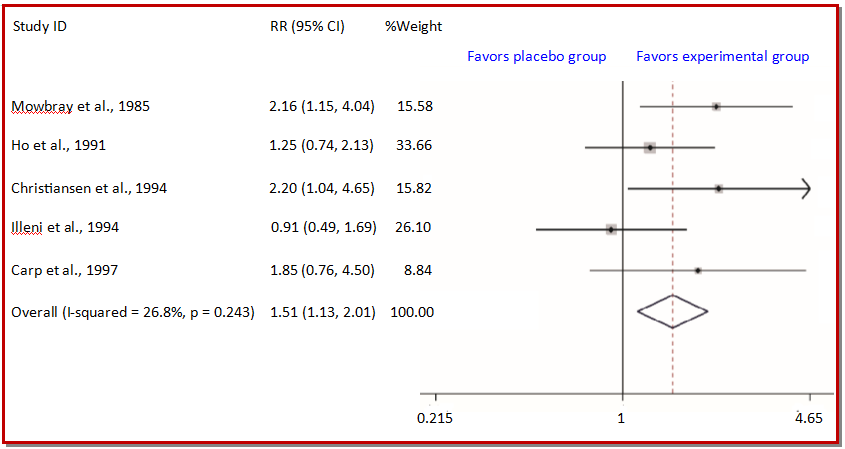
| ☲ To illustrate summary data, particularly in meta-analyses.
☲ The data are presented both tabularly and graphically. ☲ The sources (with years and citations) should comprise the first column. ☲ Provide indicators of both directions of results at the top of the plot on either side of the vertical line (eg., favors intervention). ☲ Typically, proportionally sized boxes represent the weight of each study and a diamond shows the overall effect at the bottom of the plot. |
Photograph (examples)
Images are used to support the experimental description and the discussion of the findings.
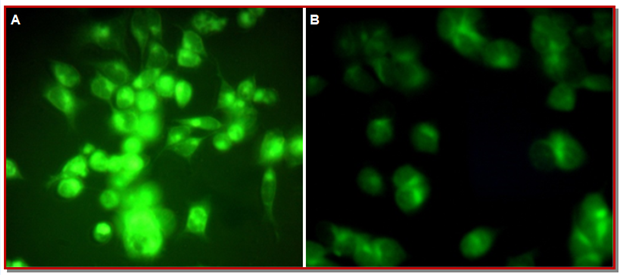
| ☲ Do not write the alphabet like “A†or “B†within the photograph. We shall add while publish
☲ Pixel size must be more than 800; We shall reduce it to the appropriate size |
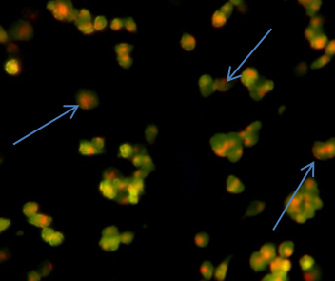
| ☲ The arrow or arrowhead on the photograph allows for easy understanding
☲ To display experimental results or histological biopsy specimens. ☲ Legends for photomicrographs should include details about the type of stain used and magnification. ☲ Provide information like the a) camera used to take this image, b) date of taking an image, c) resolution, and d) software used for image processing. In the case of an image obtained from the microscope, magnification must be mentioned in the legend. ☲ Adjustment of brightness, contrast, or color balance of an image is acceptable if it is applied to the whole image and does not obscure or eliminate any information present in the original image. ☲ Nonlinear adjustment (e.g., change to gamma setting) needs to be disclosed in the figure legend. |
Upload files (digital form)
| ☲ Provide two sets of Figures. One with completely labeled and another without the label. Label text within the Figure as font family- Arial/Calibri, 7 point.
☲ Digital files are recommended for highest quality reproduction and should follow these guidelines:
|
Authors who do not comply with these guidelines will be asked to resubmit their Figures, which may delay publication